


Synapsa Platform - Full User Guide

1 Docker installation
- docker pull synapsa/platform:latest
- docker network create --driver bridge synapsanetwork
- docker run --name synapsaredis --network=synapsanetwork -p 6379:6379 -d --restart always redis
- docker run --name synapsaweb --network=synapsanetwork --dns=8.8.8.8 --cap-add=NET_ADMIN -e PARTNER=dockertest -p 514:514/udp -p 514:514/tcp -p 80:80 -p 443:443 -p 3306:3306 -d --restart always synapsa/platform:latest
Please specify your own Partner name.
In case you are not sure try our Install guide for docker.
After installation you can access the graphical interface using a web browser. We recommend using Mozilla Firefox.
2 Initial setup
By default there is user "admin" with password "admin" which has super-user privileges.
Please change the default password after the first login to the system. We also encourage you to create multiple users with role defined privileges.
After the first login you have to provide a licence key. Licence key is provided by Synapsa Networks, APP KEY is generated during installation.
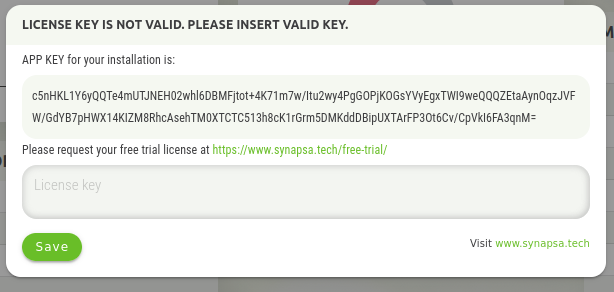
For a trial license you can use https://www.synapsa.tech/free-trial/ webpage. Purchased license will be delivered and entered by Synapsa Professional Services specialist.
After successfully entering the license, it is necessary to set the basic parameters of the instance.
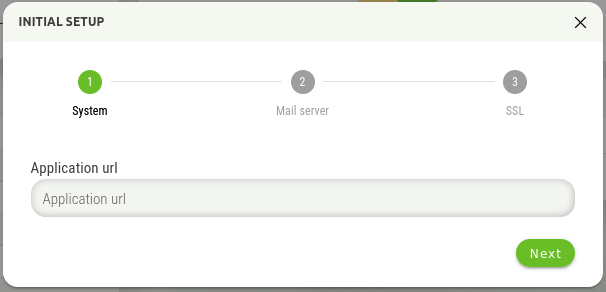
The Application URL is an address on which Synapsa runs. It is mainly used in emails, or when password reset is engaged.
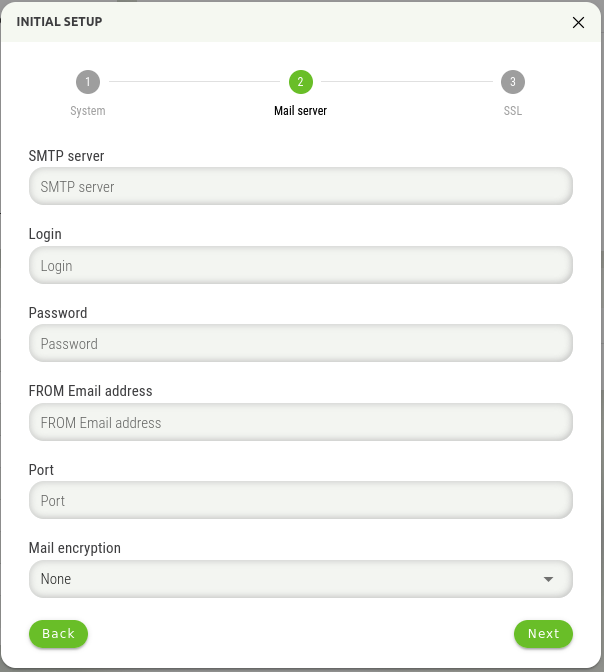
The next step is to enter the information about the mail server, where it is necessary to enter the following information:
- SMTP Server IP – Address or FQDN of the mail server
- Login – Username for sender mail account
- Password – Password for sender mail account
- FROM Email address – Email address from which emails will be sent
- Port – SMTP port of the mail server
- Mail encryption – Encryption method with communication between Synapsa and mail server
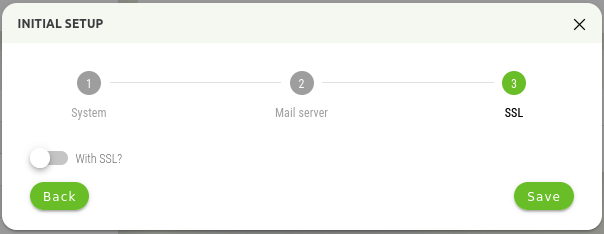
In this step, it is possible to enable secure connection to Synapsa GUI using a https connection. You can leave the default setting, Synapsa then will be accessible on http.
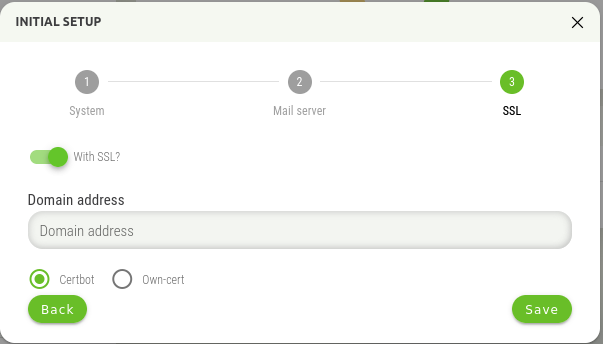
If you use SSL, there are two options, use the Certbot functionality, or the option to use your own certificate. For the Certbot functionality, the Let's Encrypt service is used to create the certificate.
WARNING! Using the Certbot functionality requires direct access to Synapsa from the Internet during certificate generation and verification! If Synapsa is not available from the Internet during this process (or renewal), the application of the certificate will be unsuccessful!
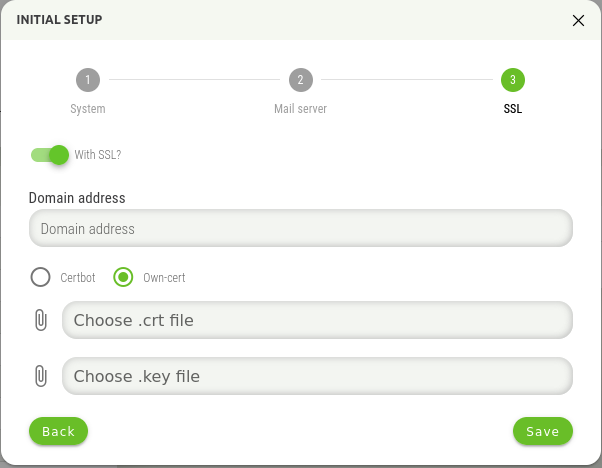
The second option is to use your own certificate, when it is necessary to insert this certificate into the displayed window.
3 Dashboard
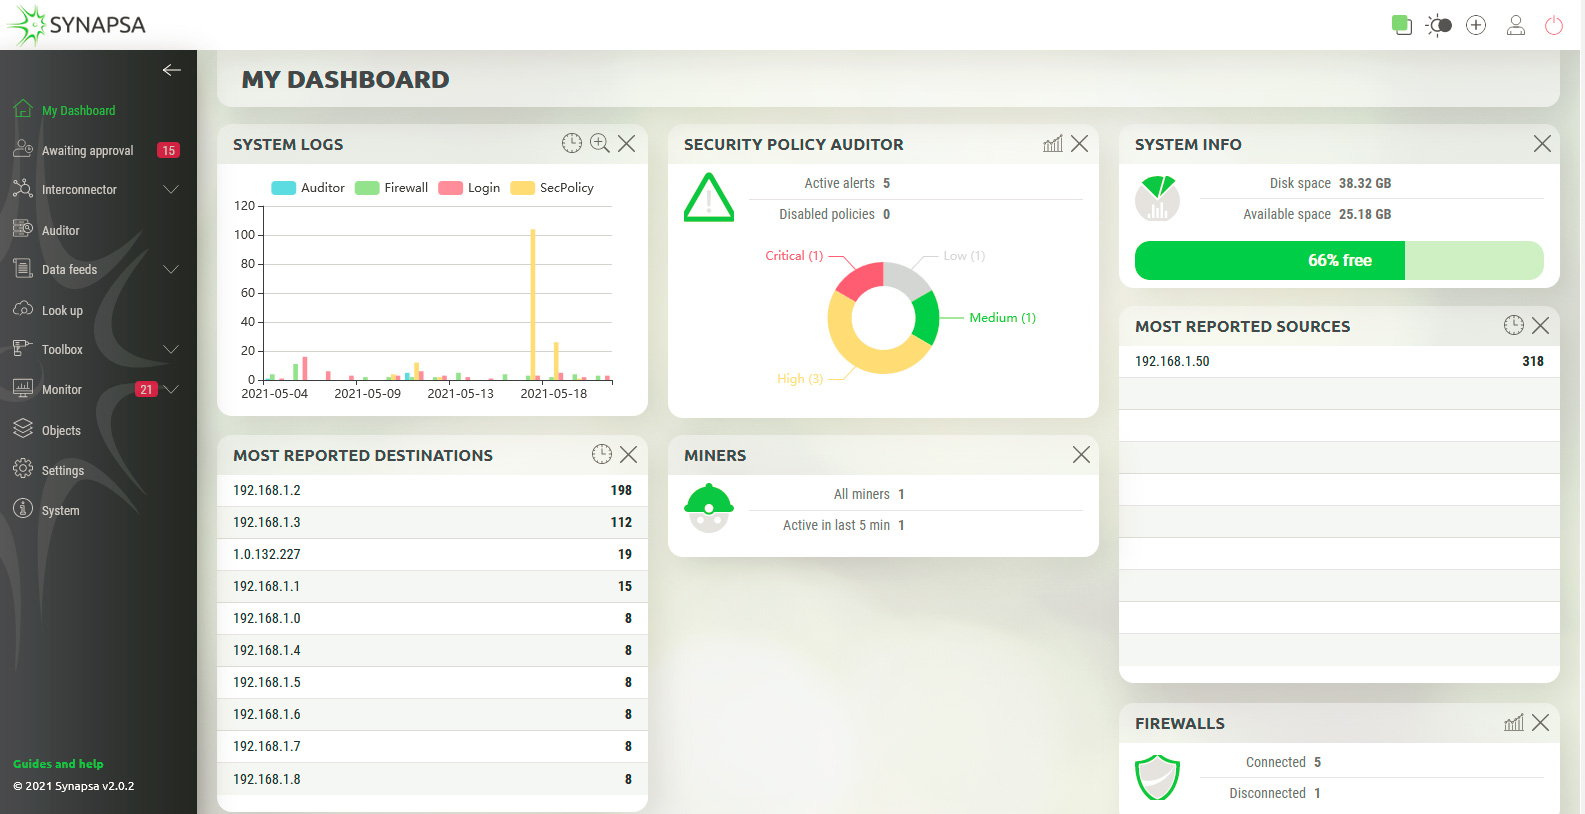
It’s full of widgets showing you data and charts about various categories.
It’s full of widgets showing you data and charts about various categories. In the left part of the screen there is the main menu, which can be hidden using the arrow at the top.The number in the red rectangle indicates the number of active items in the particular menu.

There are two modes, light mode, as you can see on previous screen, but this mode can be changed to dark mode with button in the upper right corner.

Clicking on this icon will display information about currently logged user.

The last icon, will perform logout from Synapsa.
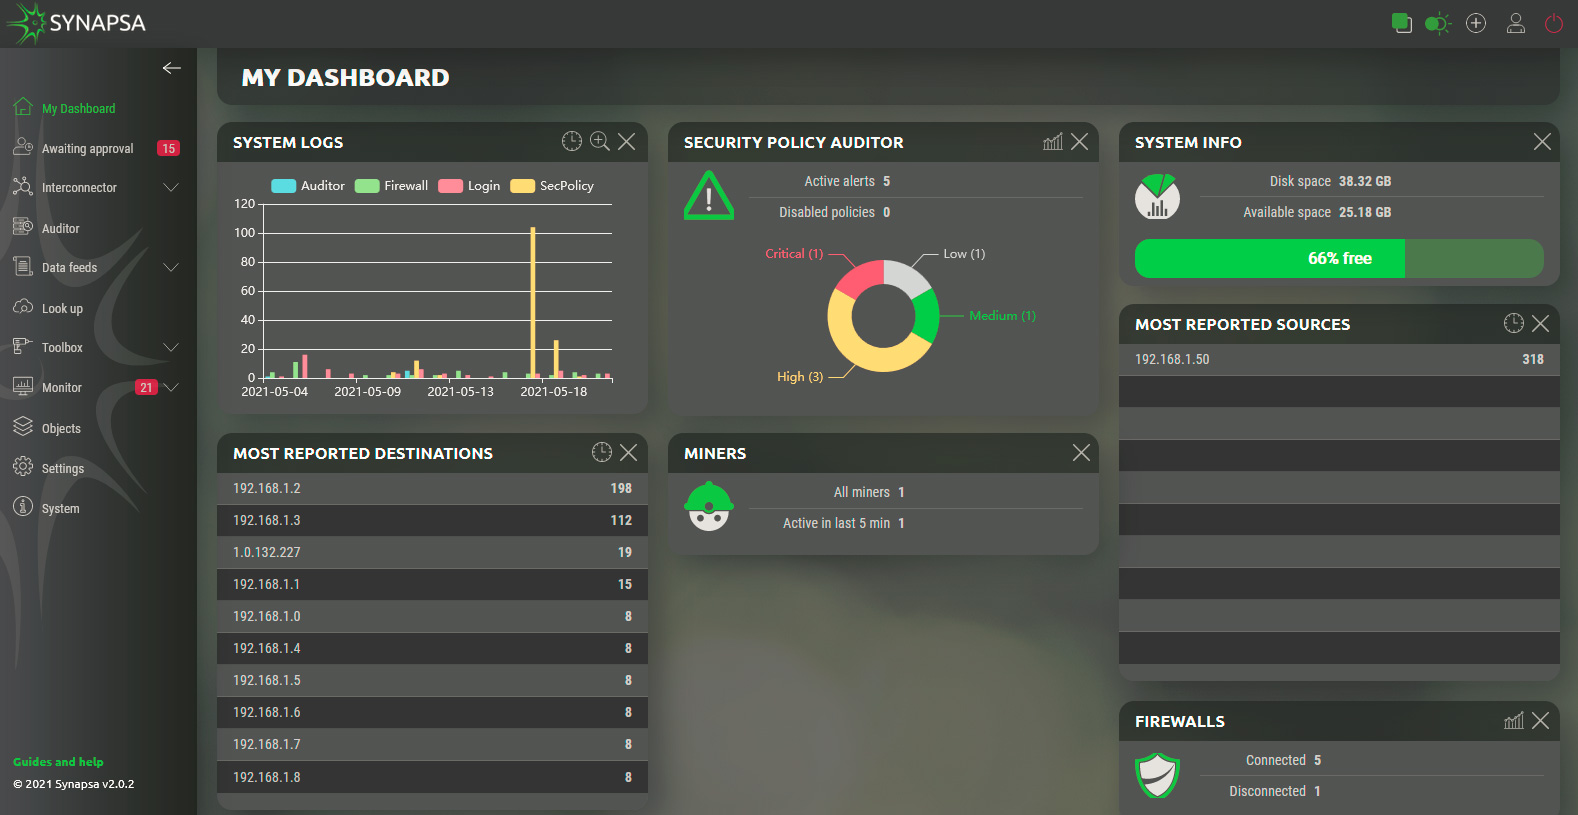
3.1 Dashboard widgets
There are widgets that can be used on everyday basic tasks with Synapsa. You can freely rearrange widgets in the dashboard for your better work experience with Synapsa.
| System Logs | Displays the graphical information about matched rules over the time. |
| Security Policy Auditor | Displays the number of active Auditor alerts a disabled policies, it shows a graph about current severity distribution of Auditor policies. |
| System Info | Showing total and free disk space. You can make more available space by deleting old events and logs. |
| Most Reported Sources | Displays list of top 15 reported source IP addresses in the received Threats, sorted by the most reported. |
| Most Reported Destinations | Displays list of top 15 reported source IP addresses in the received Threats, sorted by the most reported. |
| Miners | Showing the current number of total and active Miners. |
| Firewalls | Showing the current number of connected and disconnected Firewalls. |
3.2 Dashboard controls
On each widget you can see some icons. These represent some options you can use while working with widgets.

This icon wiil allows you to choose the timeframe of displayed information (Last 24 hours, Last Two Days, etc.)

“Plus” icon will enlarge the graph in particular widget.

Turn the graph on/off for a particular widget.
The last icon “X”, present on each widget, will close the widget.
4 Awaiting approval
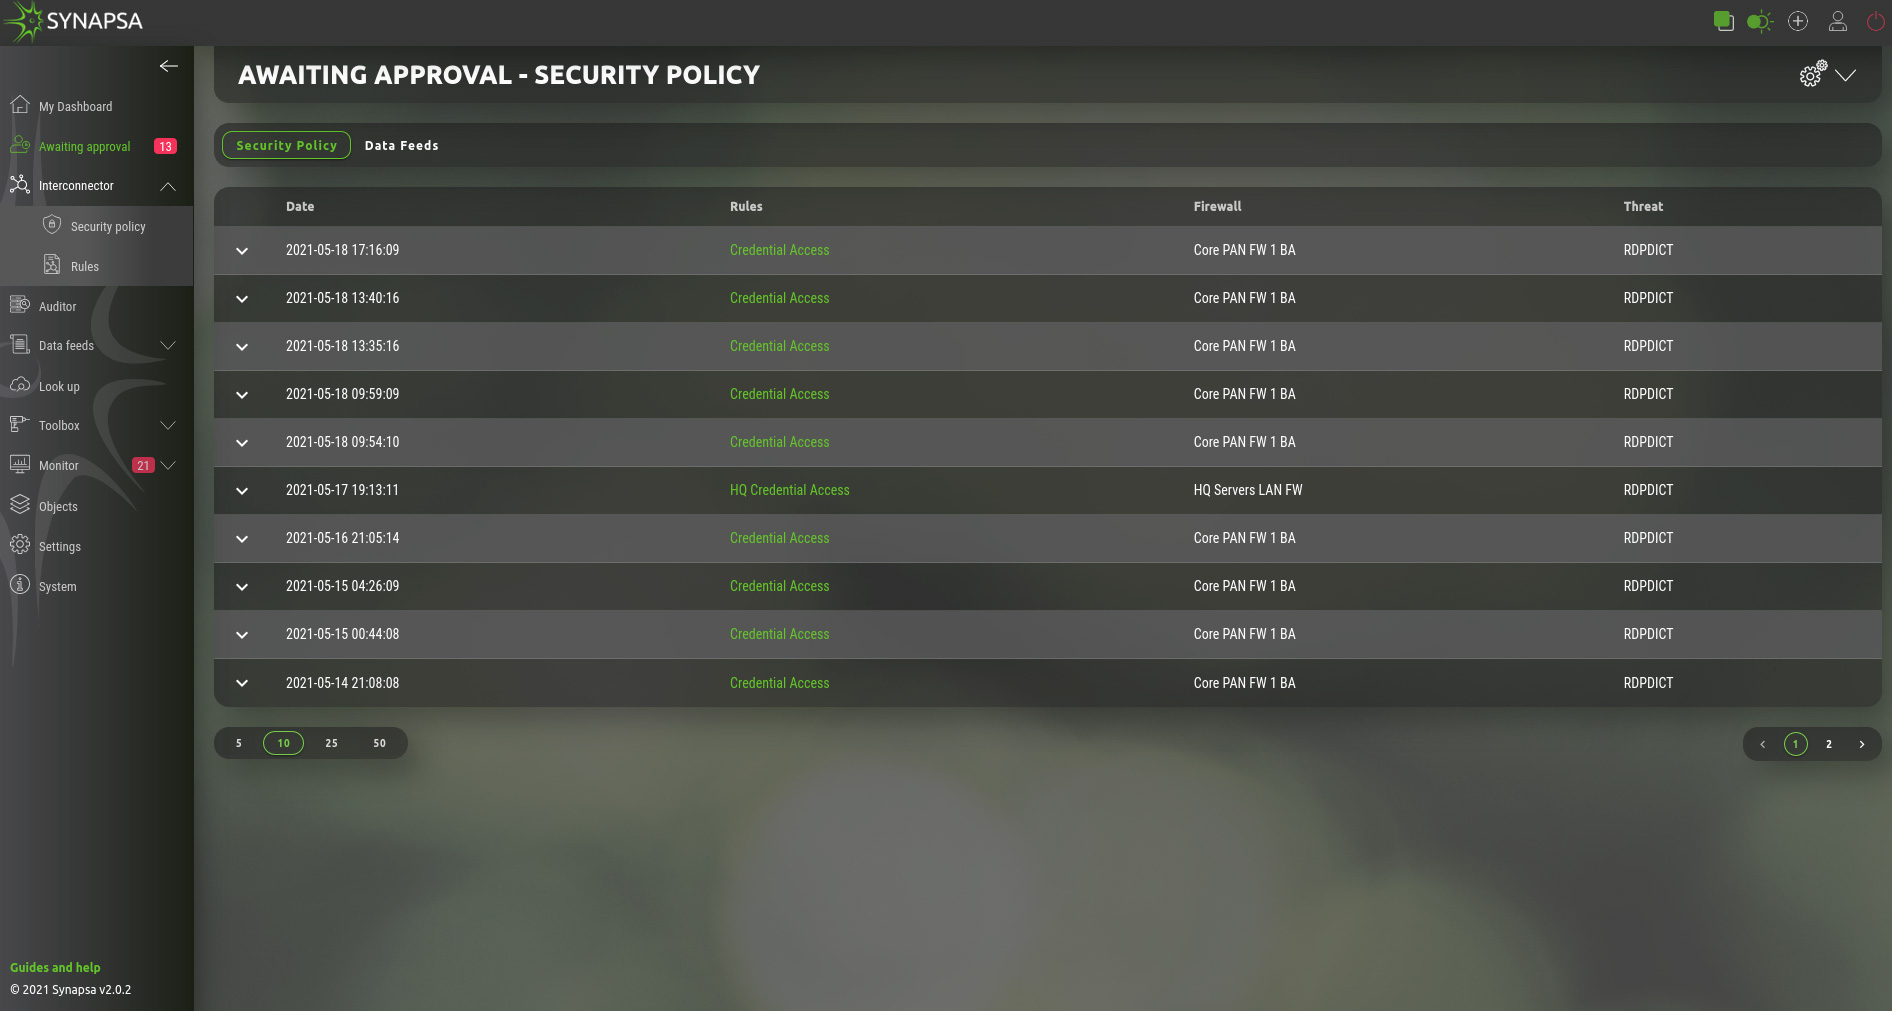
This section shows all the processed events by existing Rules, which are type On-Approval. Click on a prepared event where you can either confirm or reject the event to be processed. Output from the event will be stored in the API call logs.
4.1 Security policy
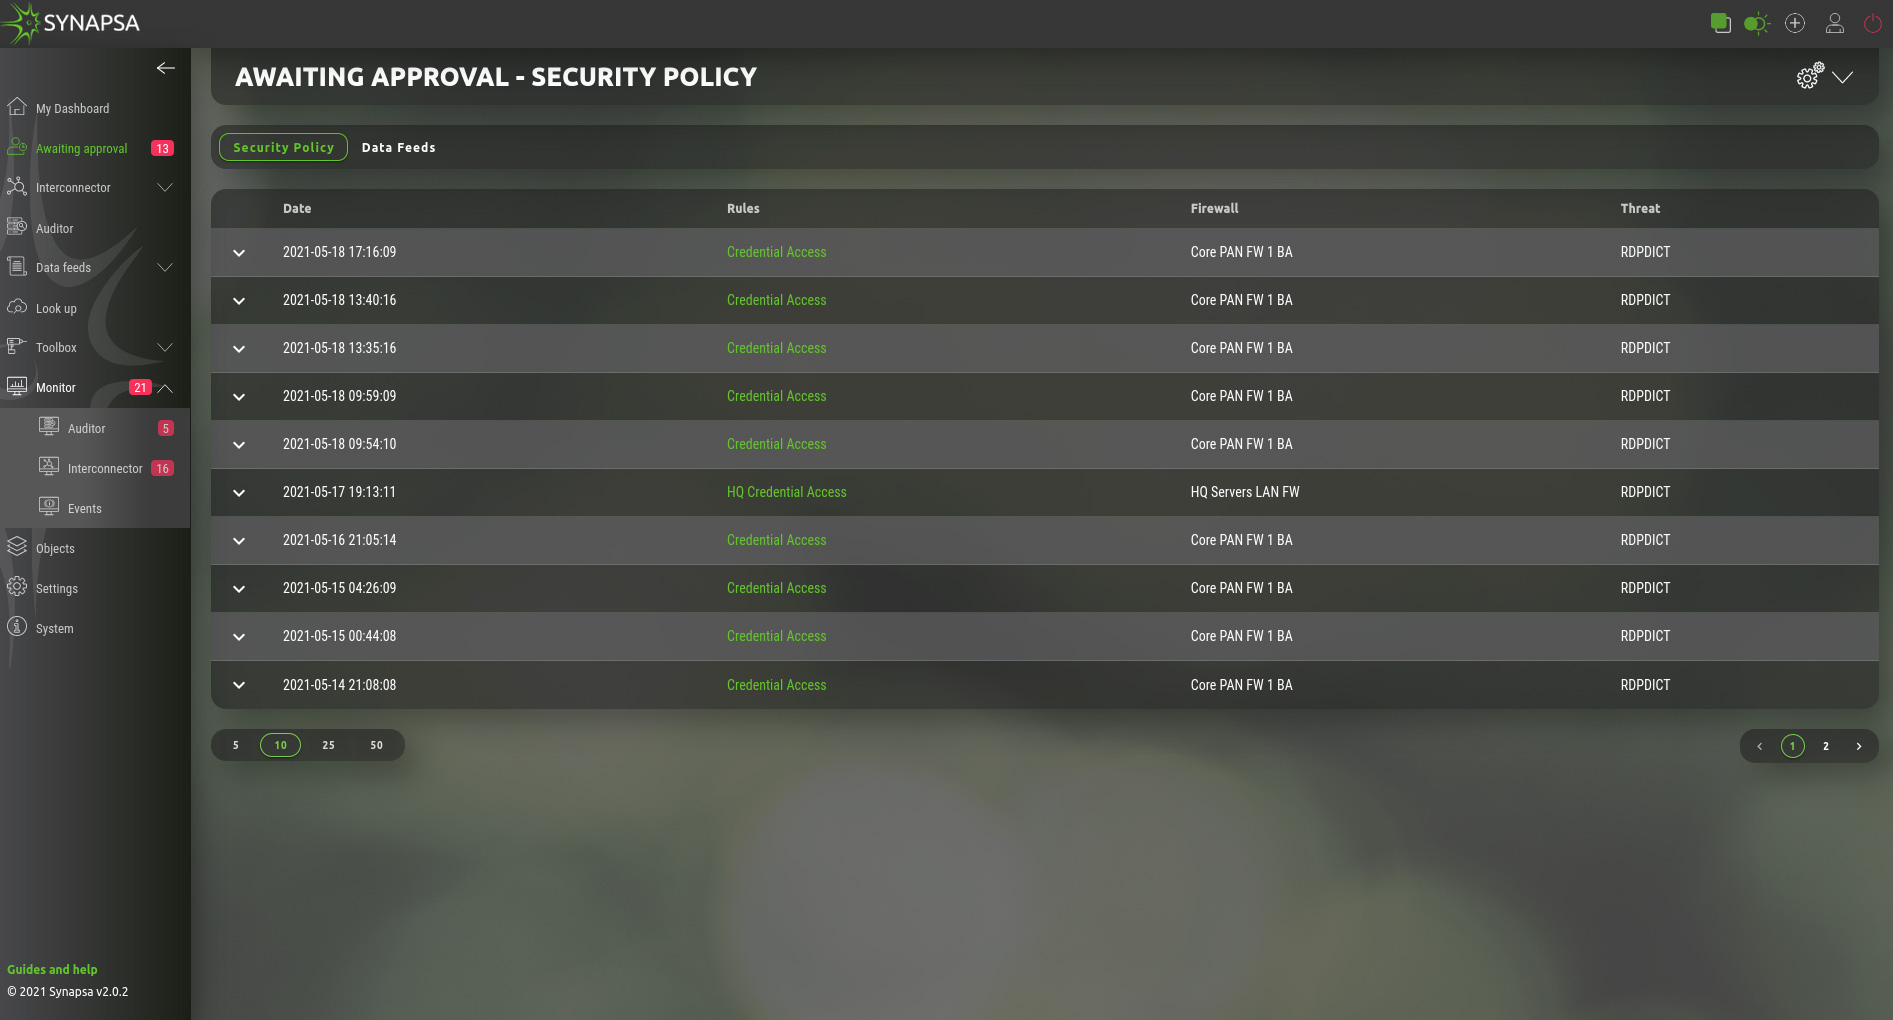
Under this section you see the security policies prepared for deployment by Synapsa on the firewalls based on user defined rules.
By clicking on a security policy you see the complete API calls and you can choose the next action:.
- Reject – This will reject the policy and this policy will not be sent to firewall.
- Confirm – Send the policy, or update the dynamic list on firewall and commit configuration, if vendor supports config commits.
4.2 Data feeds
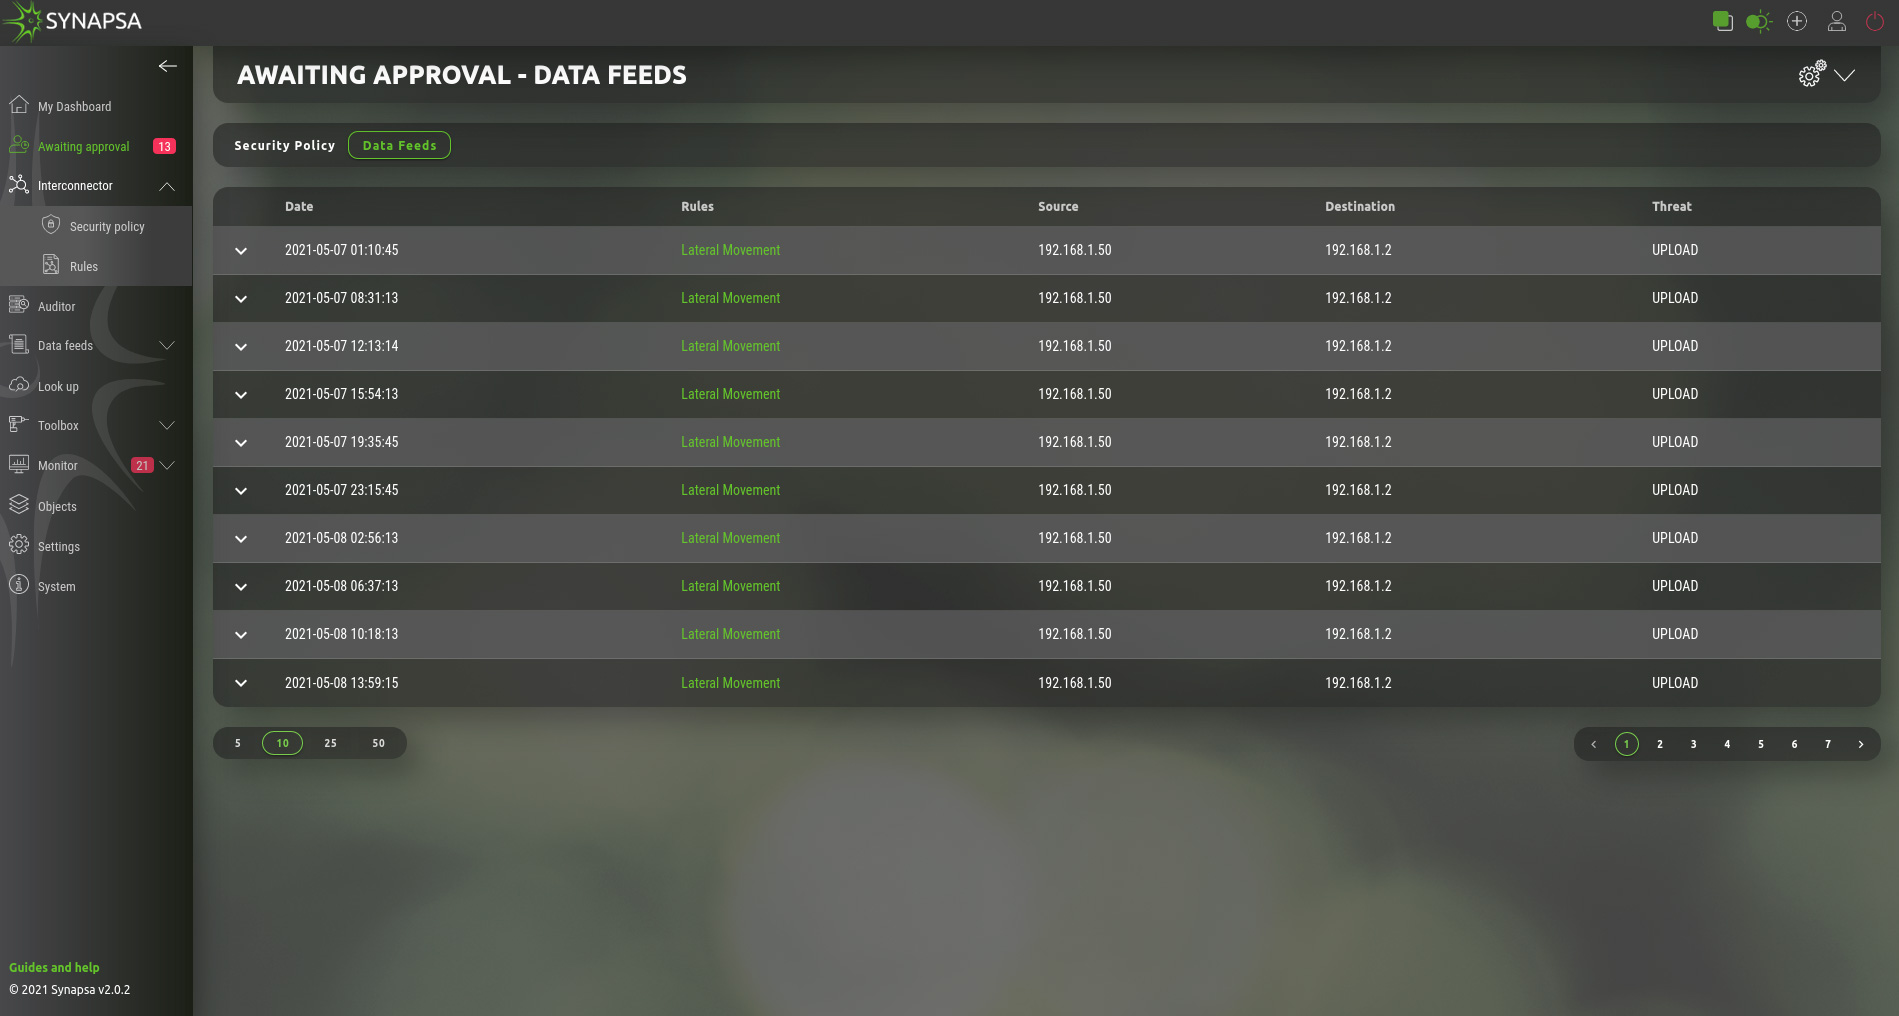
On this page you can manually update the Data Feed with an IP address, based on the rule by selecting the Send option. Reject option will not update the Data Feed and removes the policy.
5 Interconnector
Provides intelligent API based interconnections between monitoring, security and change management tools to avoid time consuming manual procedures.
5.1 Rules
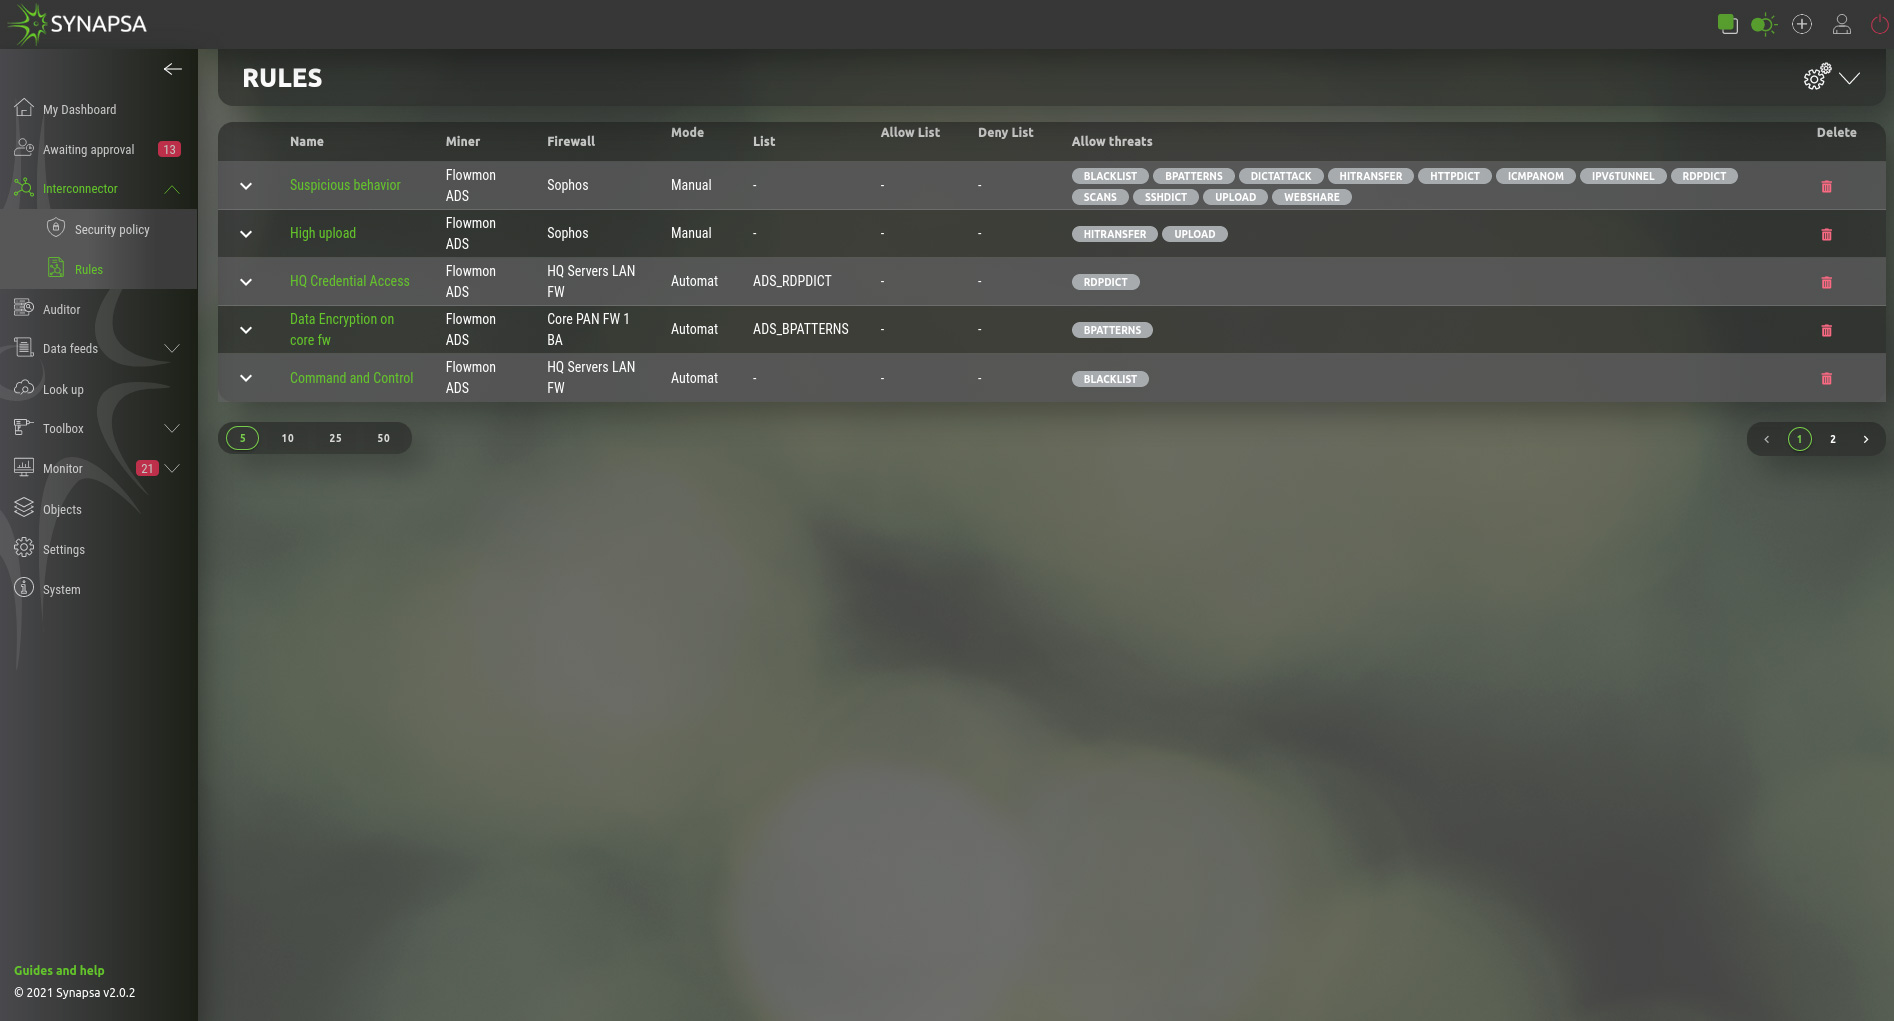
| Mode | On Approval – Actions will be prepared, but not executed until operator manually approve or reject. Automatic – All the actions configured in the rule will be executed automatically, system and API calls logs will be stored into the appropriate tables. |
| Name | Name of the rule |
| Miner | Select a miner, which will trigger the rule to be activated |
| Firewall | Select a firewall, which will respond to the rule |
| List/Allow list/Deny list | Fill source & destination IP address into list. You can have a rule which only fills the data feeds without any API calls. |
| Allow threats | Threats received from miner. |
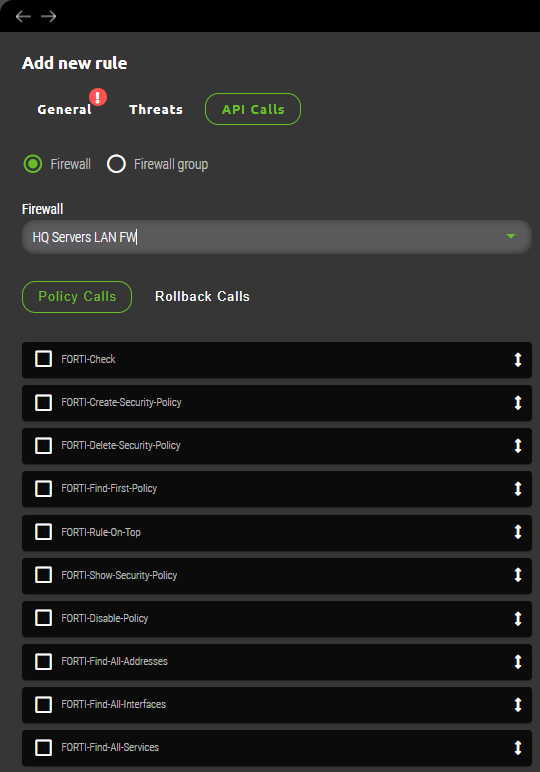
Each rule consists of a set of API calls. There are two different API calls.
| Policy Calls | Select a sequence of the API calls by ticking them, specifically for a selected firewall, to be performed when Synapsa policy is triggered. You can move the calls by dragging the arrow on the left side. The calls will be performed as they are in the list order. |
| Rollback Calls | Select a sequence of the API calls by ticking them, specifically for a selected firewall, to be performed as a rollback, if API calls to create a security policy are not fully successful. |
5.1.1 Rules configuration
After selecting new rule creation administrator needs to fill three subsections with following criteria.
5.1.1.1 General subsection
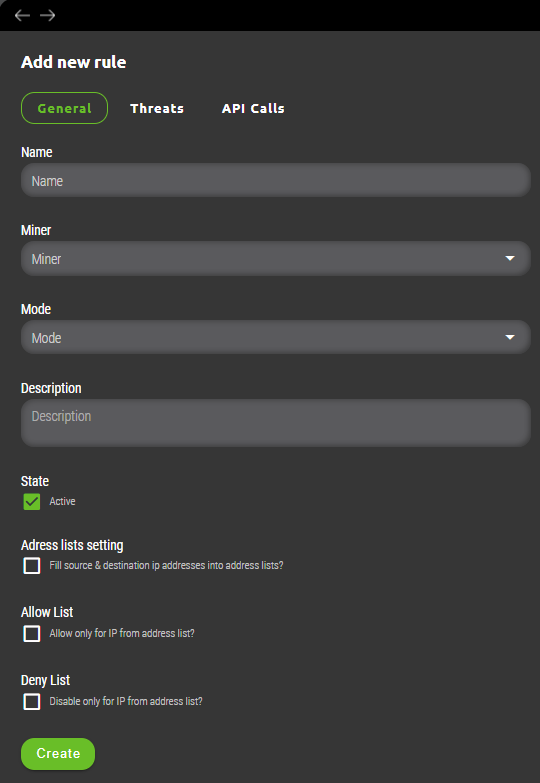
- Miner – Specified source for threats data. This source needs to be already preconfigured within Synapsa/Settings/Miners menu to appear here as drop down list.
- State – A toggle button where user can activate/deactivate given rule.
- Address lists setting – Important option which decides whether threat(s) captured by the rule is processed and implemented onto related firewall(s) directly or parsed for source and destination IP address(es) and filled into selected list(s). Lists can be created under Synapsa/Data Feeds/Address lists. Advantage of using address lists is that they can be setup as source/destination on firewall rules (if supported by vendor) and are dynamically updated without need for creating new rule for each newly announced threat.
- Allow list – Similarly to address list an administrator can specify preconfigured list of IP addresses for which traffic will be allowed.
- Deny list – Similarly to address list an administrator can specify preconfigured list of IP addresses for which traffic will be blocked.
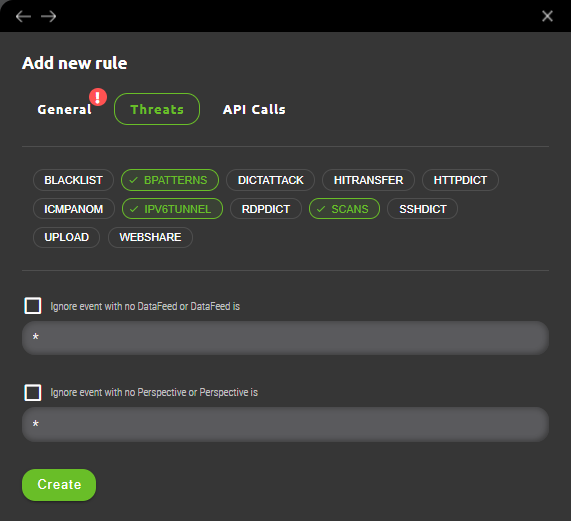
5.1.1.2 Threats subsection
Based on selected Miner various threat categories will be availabe for multi-selection. An administrator can select threats based on preference.
5.1.1.3 API calls subsection
Last configuration step for creation of Interconnector rule requires selection of Firewall and API calls to be used. Firewall selection specifies where affected rule will be implemented and selection of API calls dictates what actions are necessary to implement firewall rule or rollback in case of failure.
5.2 Security policy
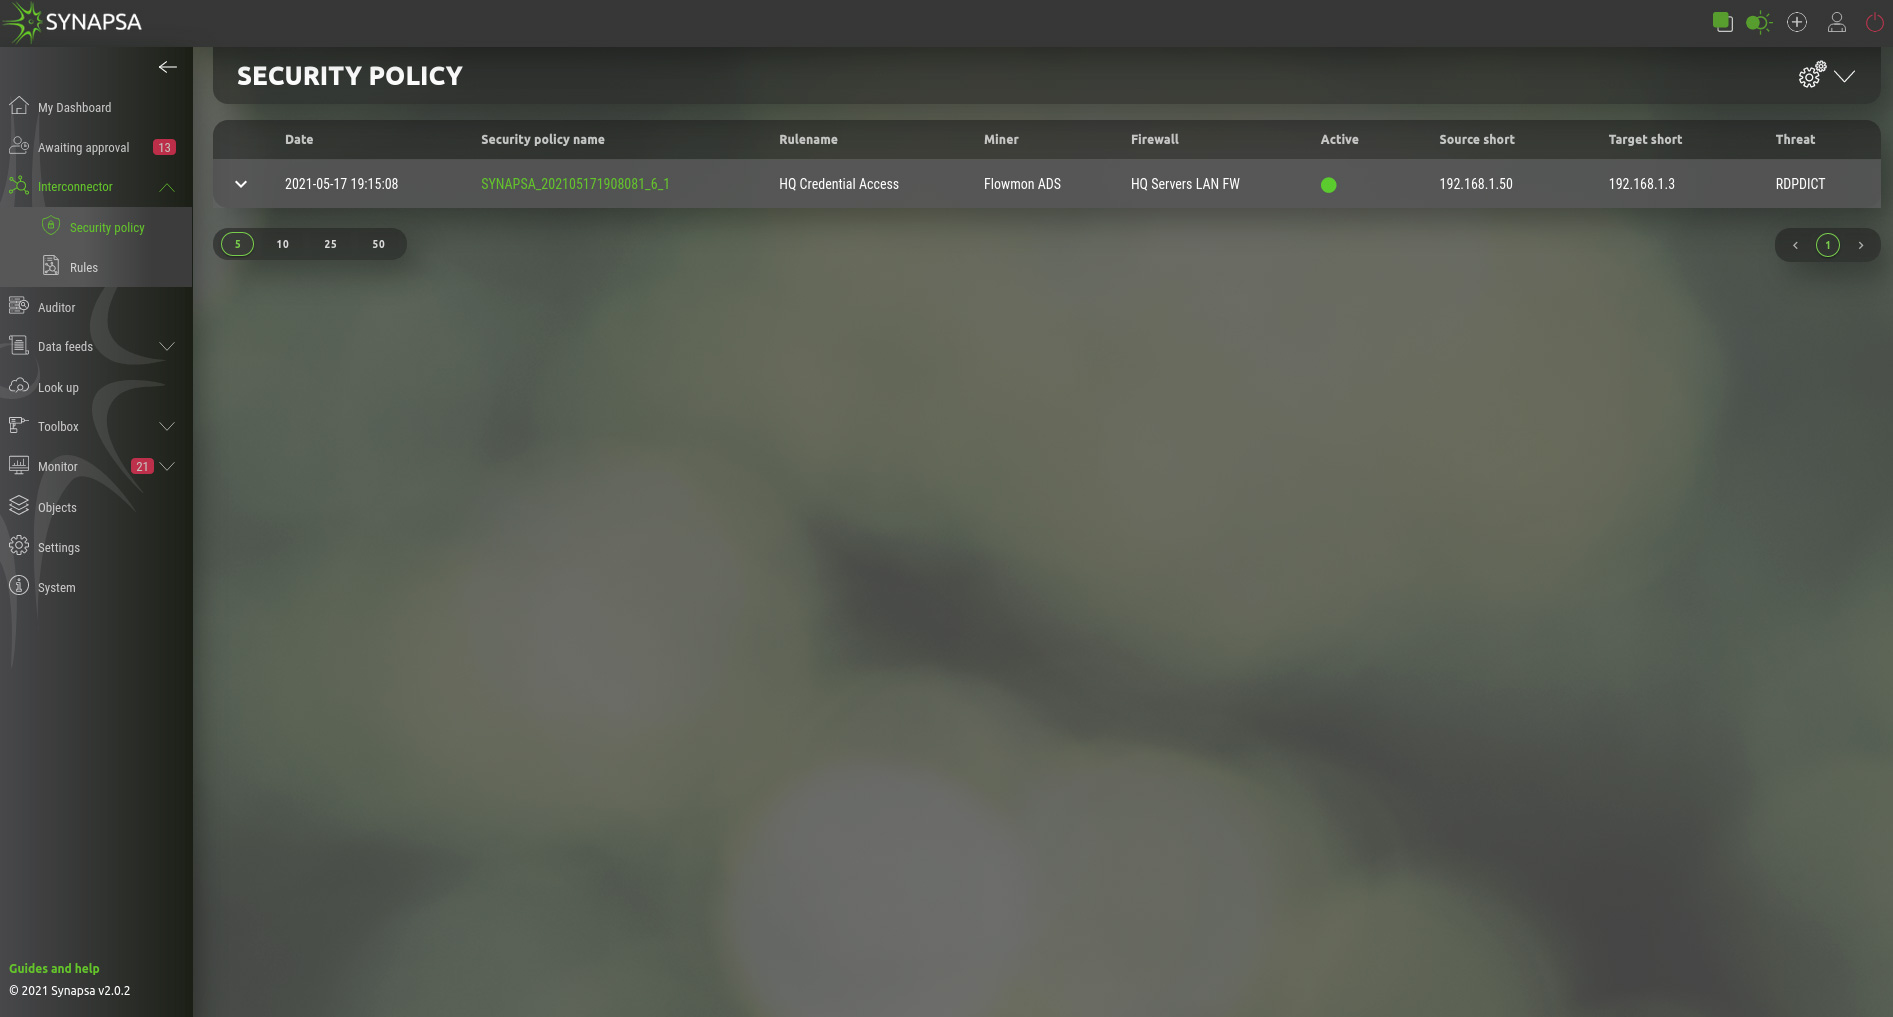
This table represents active security policies, applied to firewalls. By opening a policy you can see processed API calls and you can also revoke this policy by clicking the Revoke button.
6 Auditor
Provides an automated way for enterprise firewalls to comply with security polices, on-demand audit or effectively checks and prevents human errors caused by misconfigurations or disapproved implemented firewall changes. Additionally subsection CVE unifies up-to-date firewall security threats from various vendors under single pane.
Main subsections in Auditor are:
- Ruleset – A list of rules that are used to check security rules on firewalls
- CVE – List, where you can add CVE`s from firewall vendors.
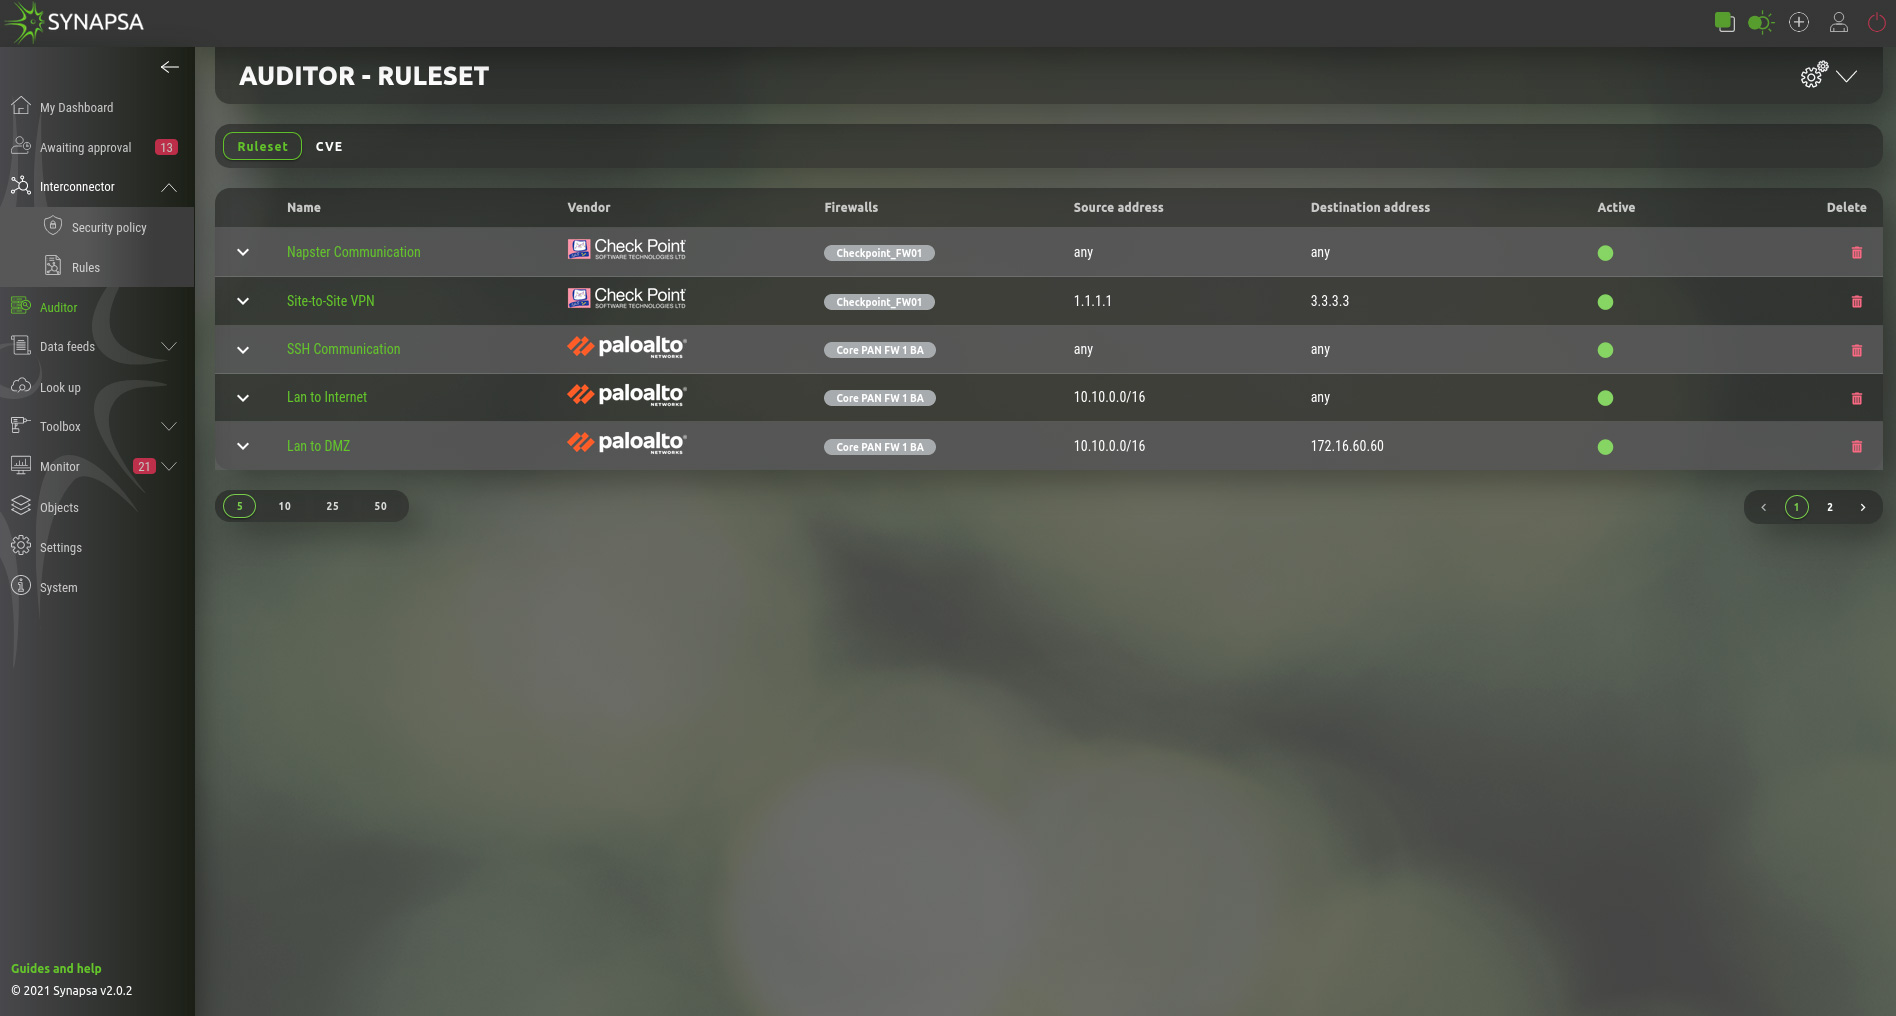
7 Auditor Ruleset
Collection of manually created rules for various firewalls that require an audit. They work in similar way as network firewall rules. System engineer creates a condition called „ruleset“ that needs to be auditioned on particular firewall or firewalls by specifying requirements that can vary from one vendor to another. Once ruleset is active, it periodically checks on particular firewall/firewalls whether any firewall security rule(s) is/are matching condition specified in Synapsa. In case of a positive match it will create an alert within Synapsa Monitor menu and it’s up to Synapsa engineer to ackowledge such alert or fix it which disables given firewall rule(s) directly from Synapsa. Another option is to automate any ruleset that will disable firewall rules not approved by company’s policy automatically without required engineer‘s interaction.
7.1 Auditor Ruleset creation
General ruleset creation for Synapsa Auditor can be found under Auditor in upper-right corner symbolized by „plus“ in a circle.
It contains two subsections. „General“ which specifies common configurations regardless of the firewall vendor and „Ruleset“ where matching conditions for individual firewall vendor are specified.
7.1.1 Auditor Ruleset creation General
An engineer needs to fill all required fields which are automatically checked in the background.
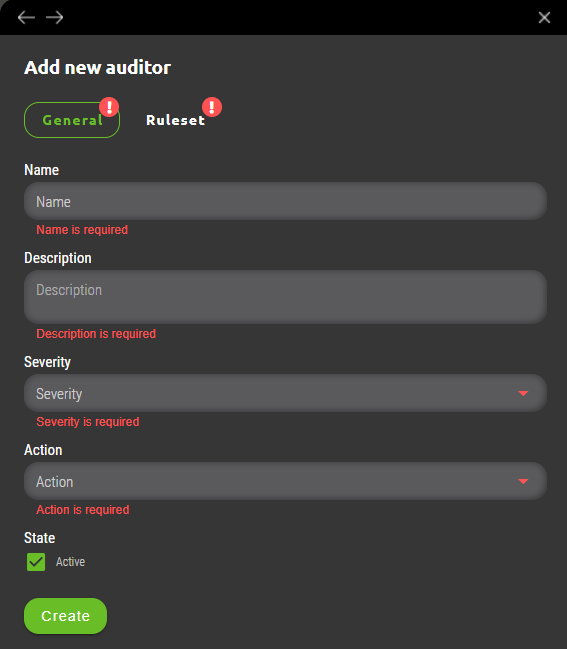
7.1.1.1 General subsection fields
- Name – A Ruleset identification which is identifying particular firewall(s) rule condition and will be displayed in Synapsa Monitor section when it’s matched against active firewall rulebase.
- Description – Additional information about created ruleset.
- Severity – User can choose from drop-down menu among four different severities. Matched rulesets will be categorized into these severities under Synapsa Monitor section based on company’s consideration which ruleset should be evaluated with higher or lower priority.
- Action – Provides two options. Alert – In case of positive match particular ruleset will trigger alert in Synapsa Monitor section. Alert and Disable – An automated option which in case of positive match will immediately disable affected rule or rules on company’s firewall.
- State – A checkbox that enables or disables given Synapsa ruleset.
7.1.2 Auditor Ruleset vendor subsection
For a complete new ruleset creation a user needs to fill firewall vendor specific section with required audit statements that needs to be automated. This section is dynamically adjusted based on firewall vendor selection.
7.1.3 Auditor Ruleset vendor Checkpoint subsection
Auditor ruleset for Checkpoint contains following fields.
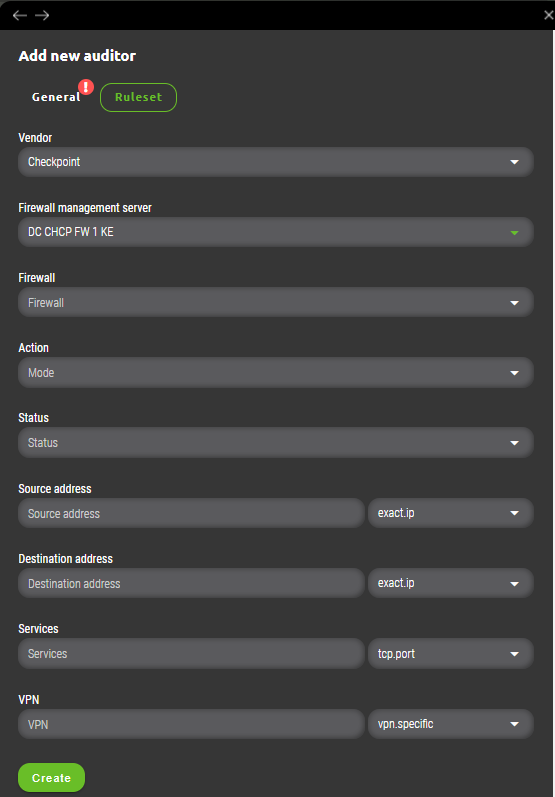
- Vendor – Firewall vendor selection.
- Firewall management server – A dropdown list with all Checkpoint management servers managed by Synapsa.
- Firewall – This list is shown only after Firewall management server is selected. User can choose one or more firewalls managed under selected management server where ruleset will be applied.
- Action – A match condition which will be checked against each firewall rule in it’s particular firewall „Action“ section. All possibilities match same actions found in firewall’s rulebase except action „Any“. This is Synapsa’s special variable that will match all firewall rules that fullfill other ruleset conditions with any value under „Action“.
- Status – Evaluates particular firewall rule to be a match only when it’s state equals to one configured in Synapsa ruleset. Values can be „Enabled“, „Disabled“ or „Any“ which will ignore evaluation of this field within firewall’s ruleset.
- Source address – Synapsa will evaluate a firewall’s rule as an alert only when it will match this condition by comparison of network source address(es). Condition possibilities can be found in related vendor chapter.
- Destination address – Synapsa will evaluate a firewall’s rule as an alert only when it will match this condition by comparison of network destination address(es). Condition possibilities can be found in related vendor chapter.
- Services – Synapsa will evaluate a firewall’s rule as an alert only when it will match this condition by comparison of network services. Condition possibilities can be found in related vendor chapter.
- VPN – Synapsa will evaluate a firewall’s rule as an alert only when it will match this condition by comparison of firewall’s „VPN“ rule section. Condition possibilities can be found in related vendor chapter.
7.1.4 Auditor Ruleset vendor Fortinet Fortigate subsection
Auditor ruleset for Fortinet Fortigate contains following fields.
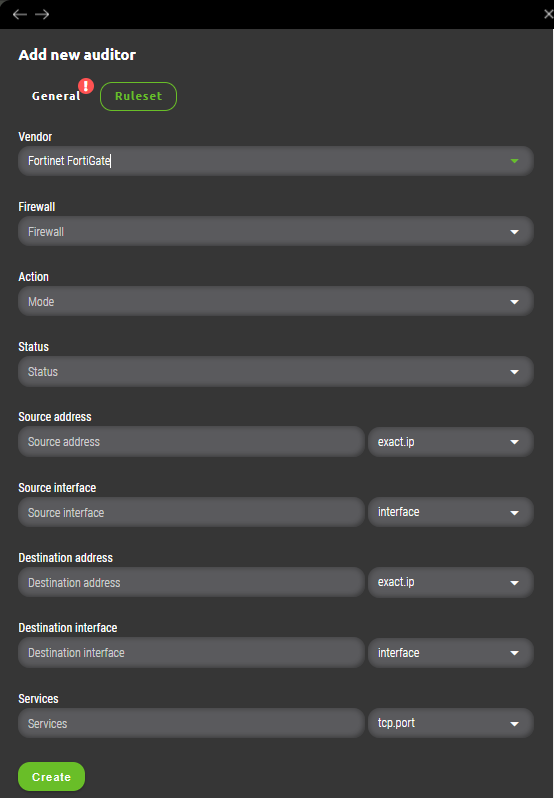
- Vendor – Firewall vendor selection.
- Firewall – User can choose one or more firewalls managed under selected management server where ruleset will be applied.
- Action – A match condition which will be checked against each firewall rule in it’s particular firewall „Action“ section. All possibilities match same actions found in firewall’s rulebase except action „Any“. This is Synapsa’s special variable that will match all firewall rules that fullfill other ruleset conditions with any value under „Action“.
- Status – Evaluates particular firewall rule to be a match only when it’s state equals to one configured in Synapsa ruleset. Values can be „Enabled“, „Disabled“ or „Any“ which will ignore evaluation of this field within firewall’s ruleset.
- Source address – Synapsa will evaluate a firewall’s rule as an alert only when it will match this condition by comparison of network source address(es). Condition possibilities can be found in related vendor chapter.
- Source interface – Synapsa will evaluate a firewall’s rule as an alert only when it will match this condition by comparison of network source interface. Condition possibilities can be found in related vendor chapter.
- Destination address – Synapsa will evaluate a firewall’s rule as an alert only when it will match this condition by comparison of network destination address(es). Condition possibilities can be found in related vendor chapter.
- Destination interface – Synapsa will evaluate a firewall’s rule as an alert only when it will match this condition by comparison of network destination interface. Condition possibilities can be found in related vendor chapter.
- Services – Synapsa will evaluate a firewall’s rule as an alert only when it will match this condition by comparison of network services. Condition possibilities can be found in related vendor chapter.
7.2 Auditor Ruleset conditions for vendor Checkpoint
A detailed guide can be found on the following link:
https://www.synapsa.tech/synapsa-firewall-auditor-checkpoint-documentation/
7.3 Auditor Ruleset conditions for vendor Fortinet
A detailed guide can be found on the following link:
https://www.synapsa.tech/synapsa-firewall-auditor-fortinet-documentation/
7.4 Auditor Ruleset conditions for vendor Palo Alto
A detailed guide can be found on the following link:
https://www.synapsa.tech/synapsa-firewall-auditor-palo-alto-documentation/
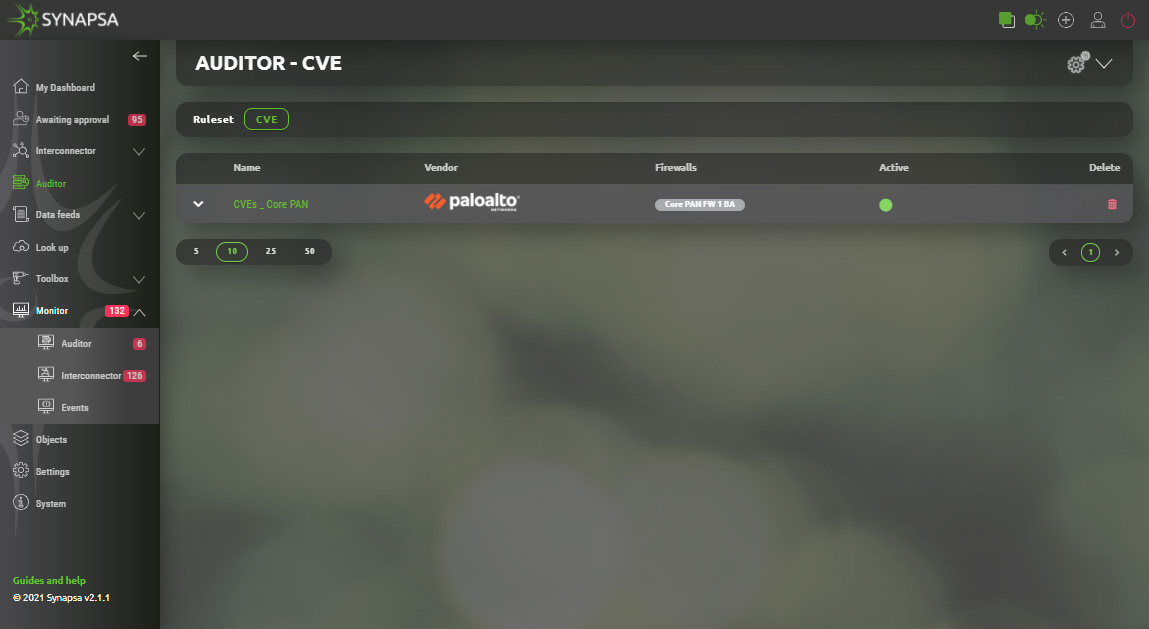
7.5 Auditor CVE
Auditor CVE provides an ultimate tool for up-to-date single pane overview of released security flaws/threats for all firewalls managed by Synapsa. Process is fully automated therefore user just needs to decide which firewall(s) to monitor for flaws by creating a rule. All rules are periodically checked against vendor’s security advisory lists and interprated by Synapsa system. All identified issues are displayed under Synapsa/Monitor/Auditor/CVE section.7.5.1 Auditor CVE section
General ruleset creation for Synapsa Auditor CVE can be found after selecting CVE subsection under Auditor in upper-right corner symbolized by „plus“ in a circle.
7.5.2 Auditor CVE creation
User needs to provide following information for CVE Auditor rule creation.
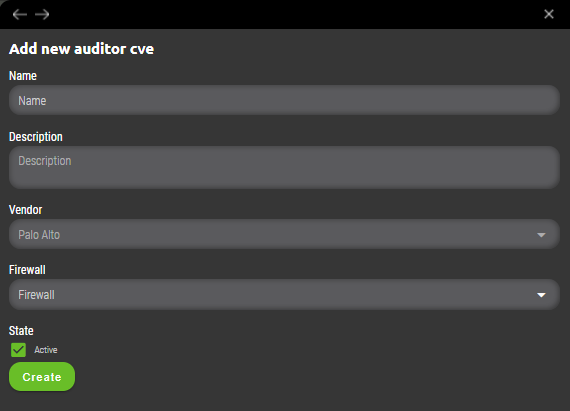
- Name – An identifying rule name that will be displayed in Synapsa Auditor CVE section.
- Description – Descriptive information about created rule.
- Vendor – Selection of firewall vendor.
- Firewall – Selection of Synapsa’s managed firewall(s) where all CVE needs to be monitored and reported.
- State – A checkbox that enables or disables given Synapsa rule.
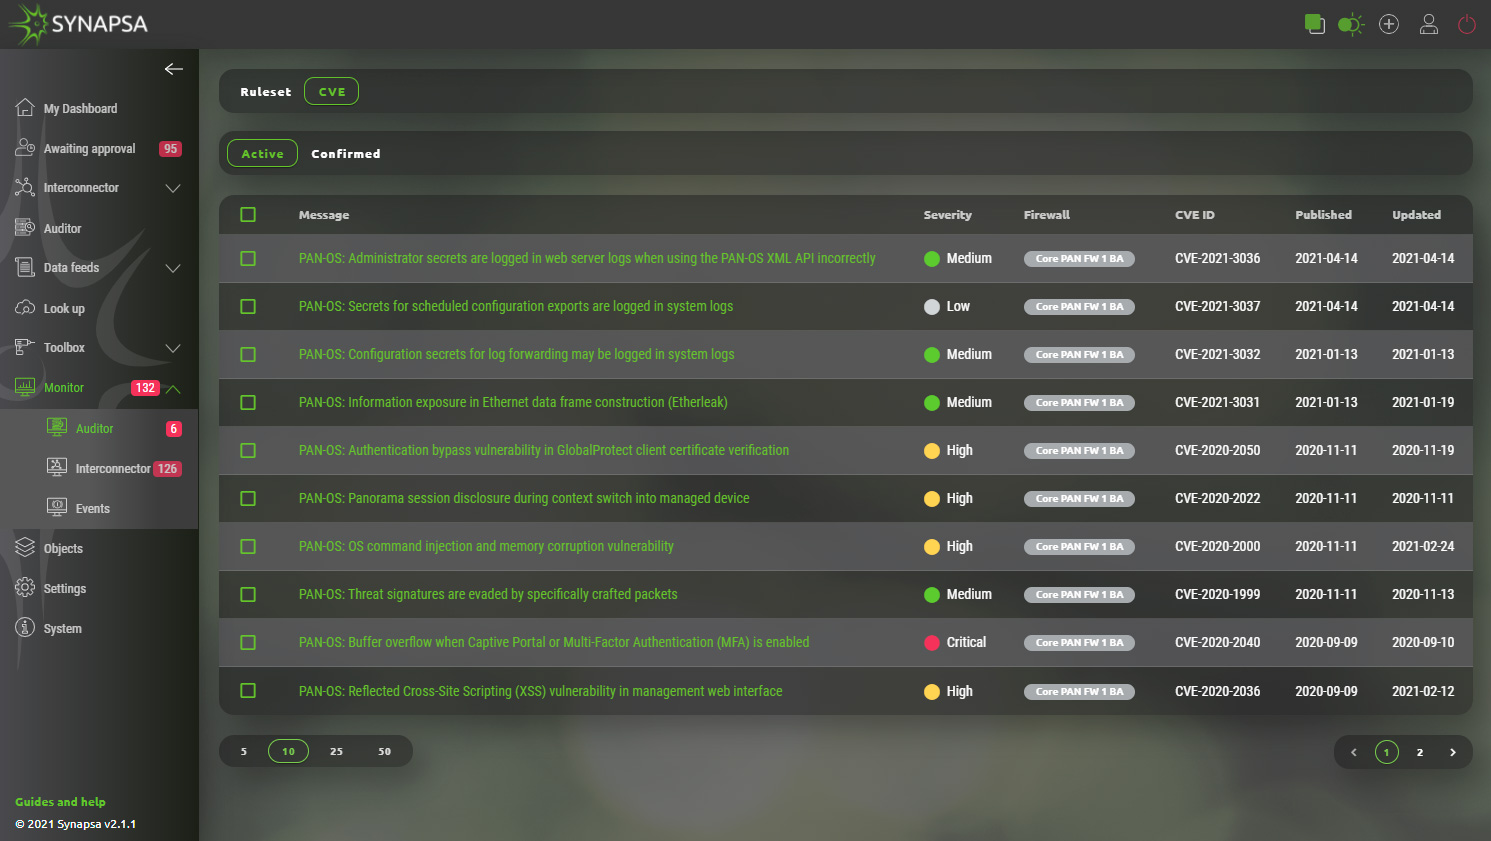
7.5.3 Auditor CVE monitor
All identified issues released by Vendor for given Firewall and it’s version can be found under Synapsa/Monitor/Auditor/CVE section. They all include description, severity, unique CVE ID, dates (published,updated) and Firewall which is affected by them. Opening each CVE issue provides additional information and possibility to acknowledge it.
8 Data Feeds
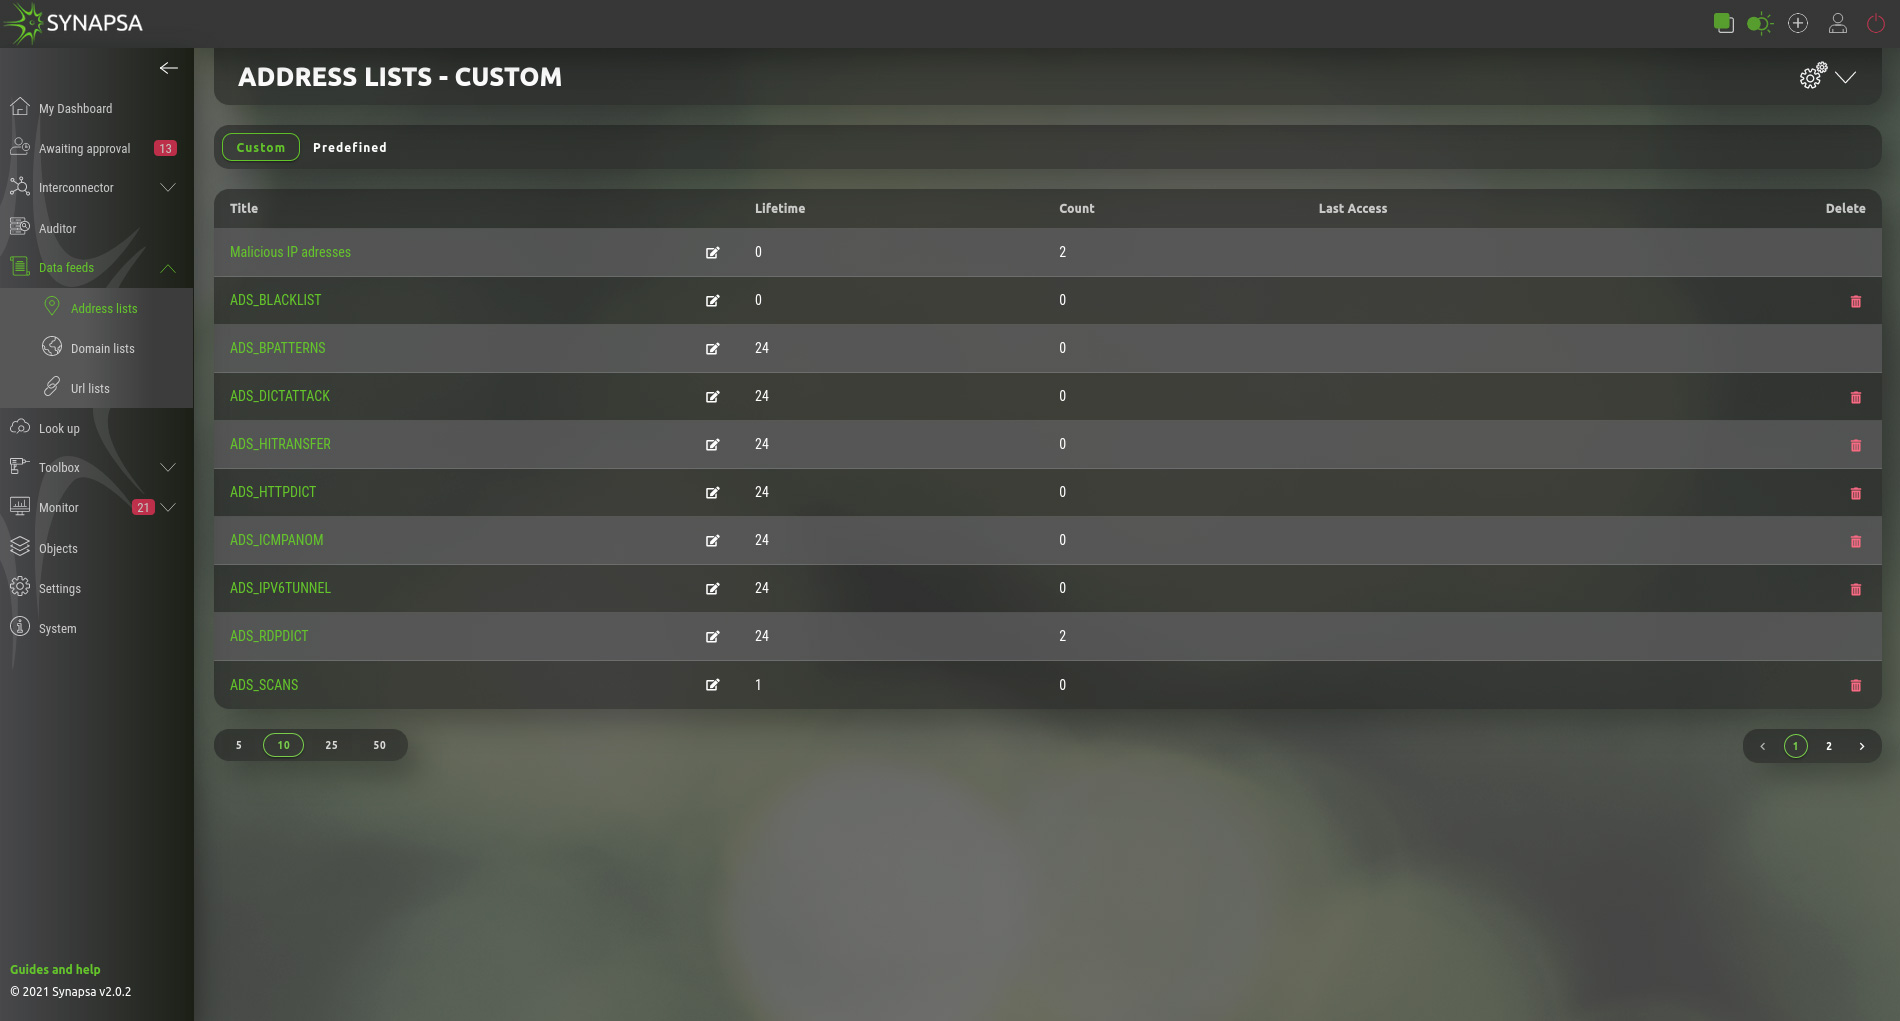
- Title – Name of the list.
- Lifetime – Lifetime of record which started counting when record was added to the list. If there is another event adding the same record to the same list, the lifetime will restart. If there is no event adding the same record, the record will disappear from the list when lifetime is reached. Lifetime “0” (zero) means disabled lifetime.
- Count – Showing how many records are active in the list.
9 Address lists
IP address lists can only contain a valid IP address. All the same rules apply as for Address list. You can create your own lists which will be used as External Dynamic Lists for the devices loading the records into their own configuration.
- Custom – Here you can create your own address lists. For each list you can specify Lifetime (validity) in hours. Using “0” (zero) is for disable lifetime.
- Predefined – List of IP addresses for public services, e.g. Amazon, Office365, etc.
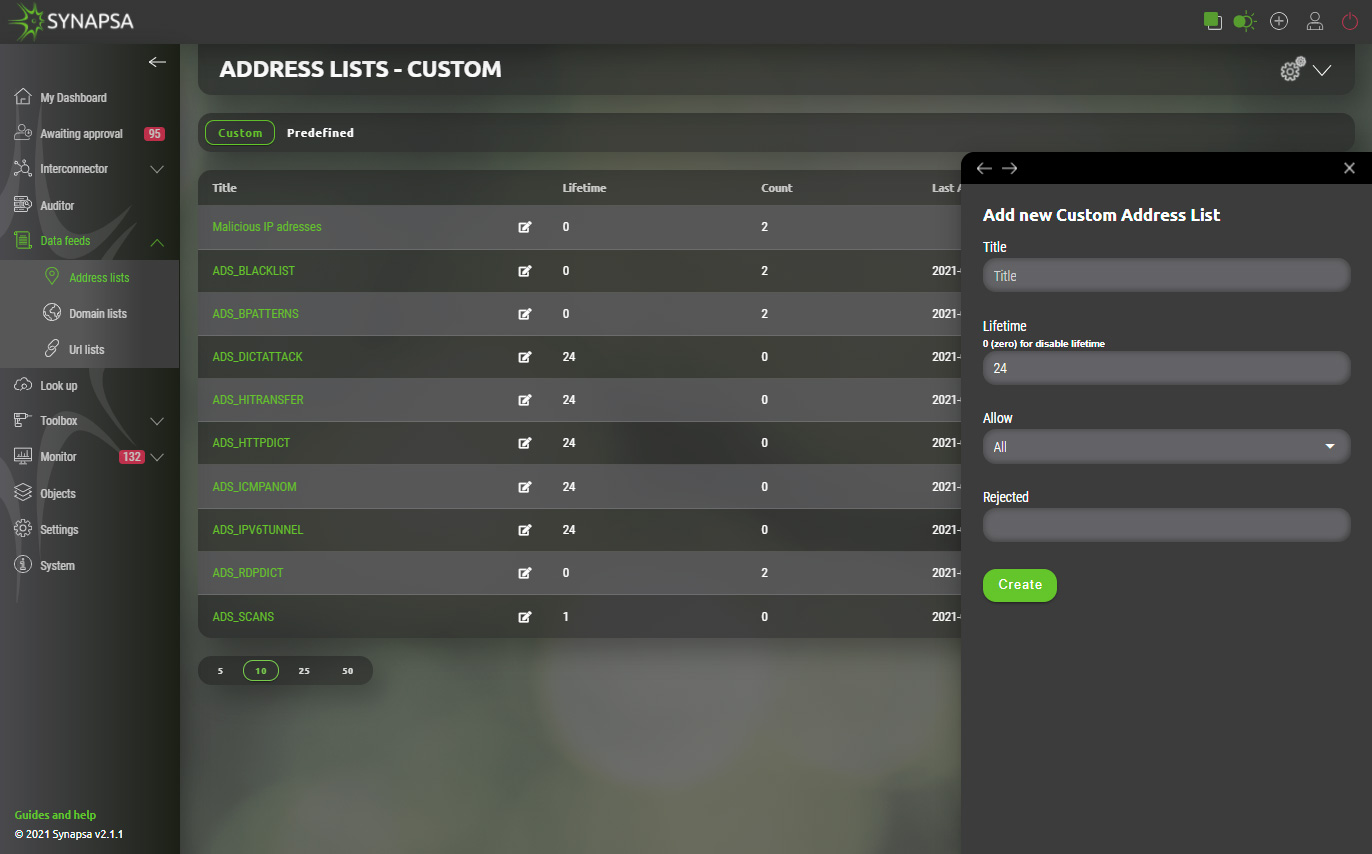
9.1 Custom Address lists
Custom address lists can contain manually configured IP addresses or can serve as containers for various automatic sources which will feed data into them automatically. Basic configuration has following parameters.
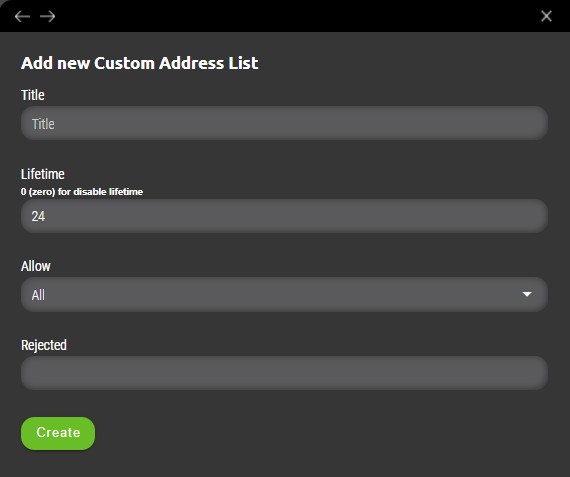
Title
Name of the custom address list.
Lifetime
Period for which data will be stored in given list.
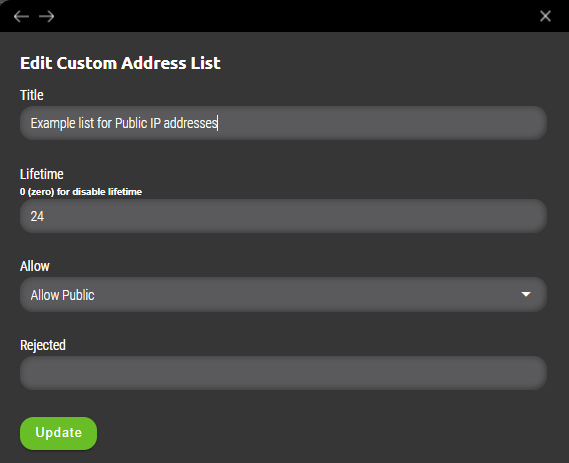
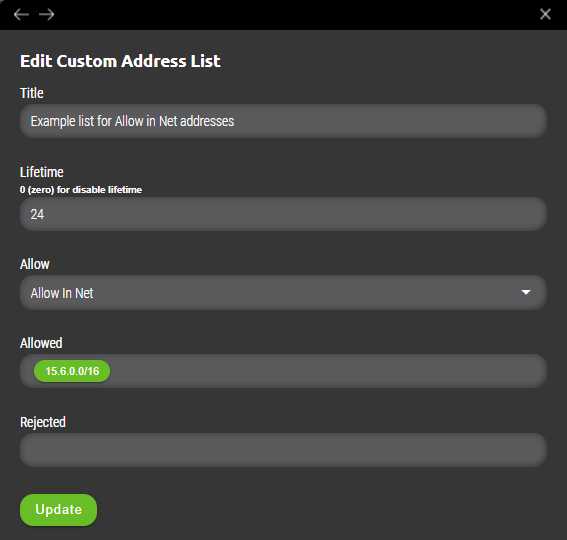
Allow
Filter for given list specifying allowed values only. Possible options are as following.
- Allow Private – Only IP addresses from private ranges are allowed to be added to address list (ranges are 10.0.0.0/8, 172.16.0.0/12, 192.168.0.0/16).
- Allow Public – Only IP addresses from public ranges are allowed to be added to address list (all except private ranges such as 10.0.0.0/8, 172.16.0.0/12, 192.168.0.0/16).
- Allow in Net – Specified filter is based on range of values definied by subnet mask. (example 10.0.0.0/8 or 44.2.0.0/16 network). Selecting this option adds „Allowed“ variable where required value(s) needs to be specified separated by tabulator key.
Rejected
Exception values from list specified in „Allow“ section. Useful when company’s policy needs to filter all private ranges but specific host is needs to be allowed into list to be further processed as suspicious.
IMPORTANT: Added value(s) needs to be separated by „Tabulator key“ to be added to address list.
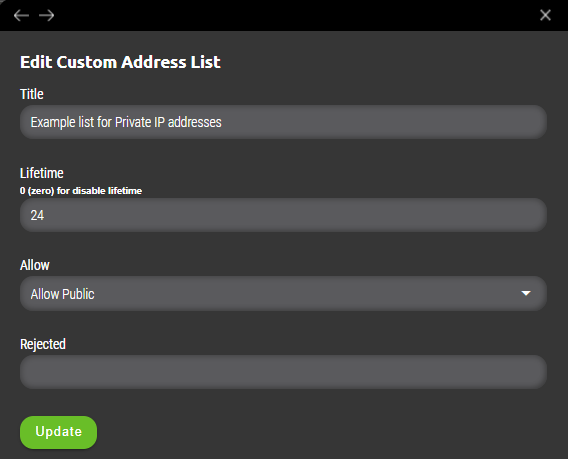
9.1.1 Example
User will define „Allow Private“ but needs to exempt host 10.66.66.66 from that list. Filter will be defined as following.
- Allow Private
- Rejected – 10.10.10.2
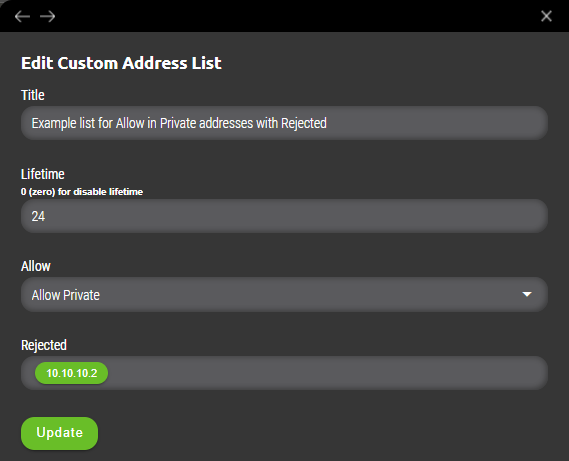
That means if any private range IP address wants to be added either manually or automatically and then processed to be implemented to firewall as a security policy, it will be added to specific address list but value included in „Rejected“ will not be added and bypassed from further implementation to firewall’s policy.
9.2 Address lists for Checkpoint
Address lists can be used in various ways for integration as referenced in Interconnector chapter. Current support for firewall vendor Checkpoint start with version R81. This version supports external data feeds as source of dynamic firewall rules. Integration with these external data can be configured in Synapsa via Address lists.User can create address list that will include manually inserted IP source and destination addresses. Creation of new address list can be found under Synapsa/Data feeds/Address lists.
Once created it can be opened for further manual configuration of source and destination IP addresses or easily imported via CSV file.
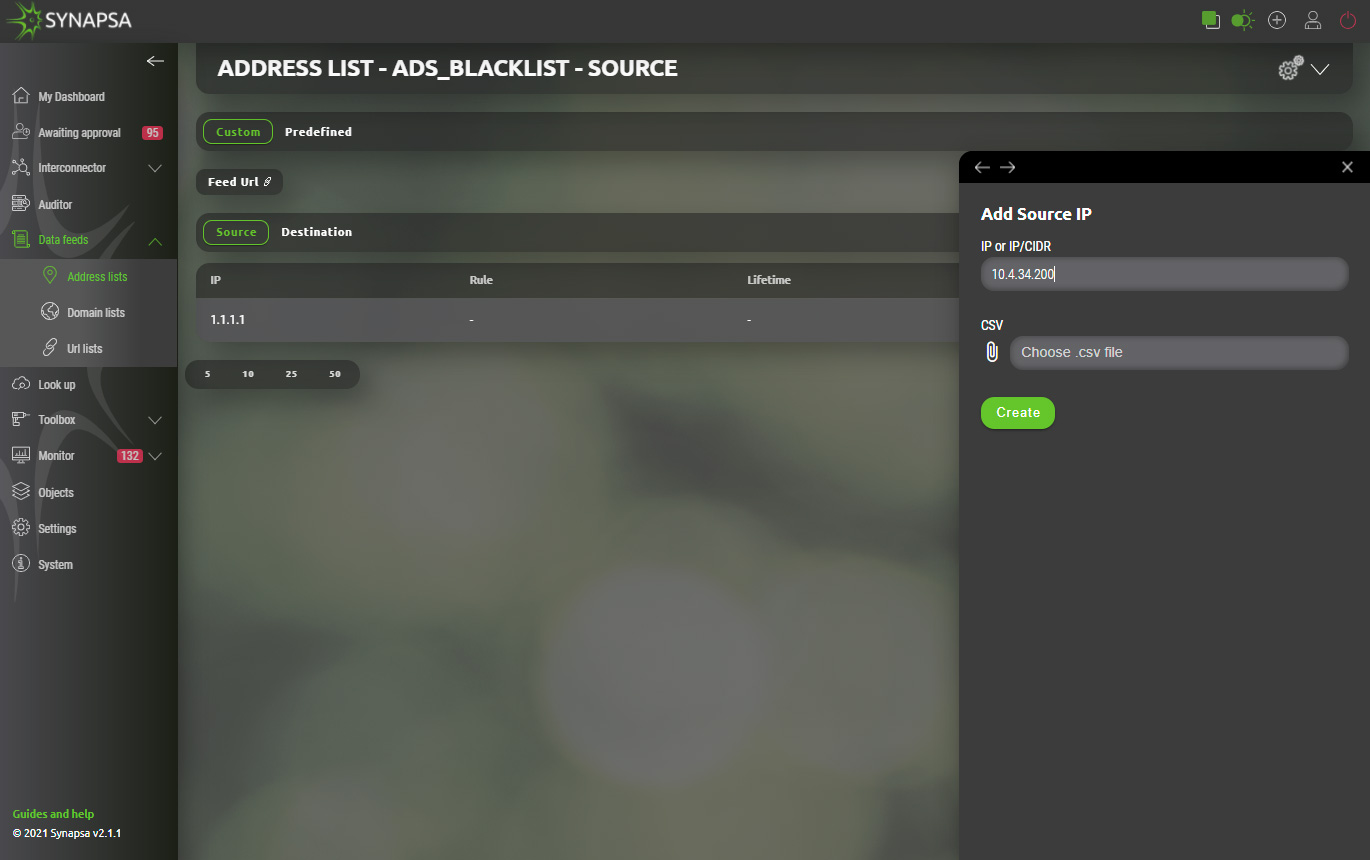
Each list provides different „Feed URL“ for source and destination address(es) separated by purpose. Checkpoint link information can be provided to firewall administrator. Integrated links to checkpoint will be automatically polling for actual values of respective address list and handle given firewall rule dynamically.
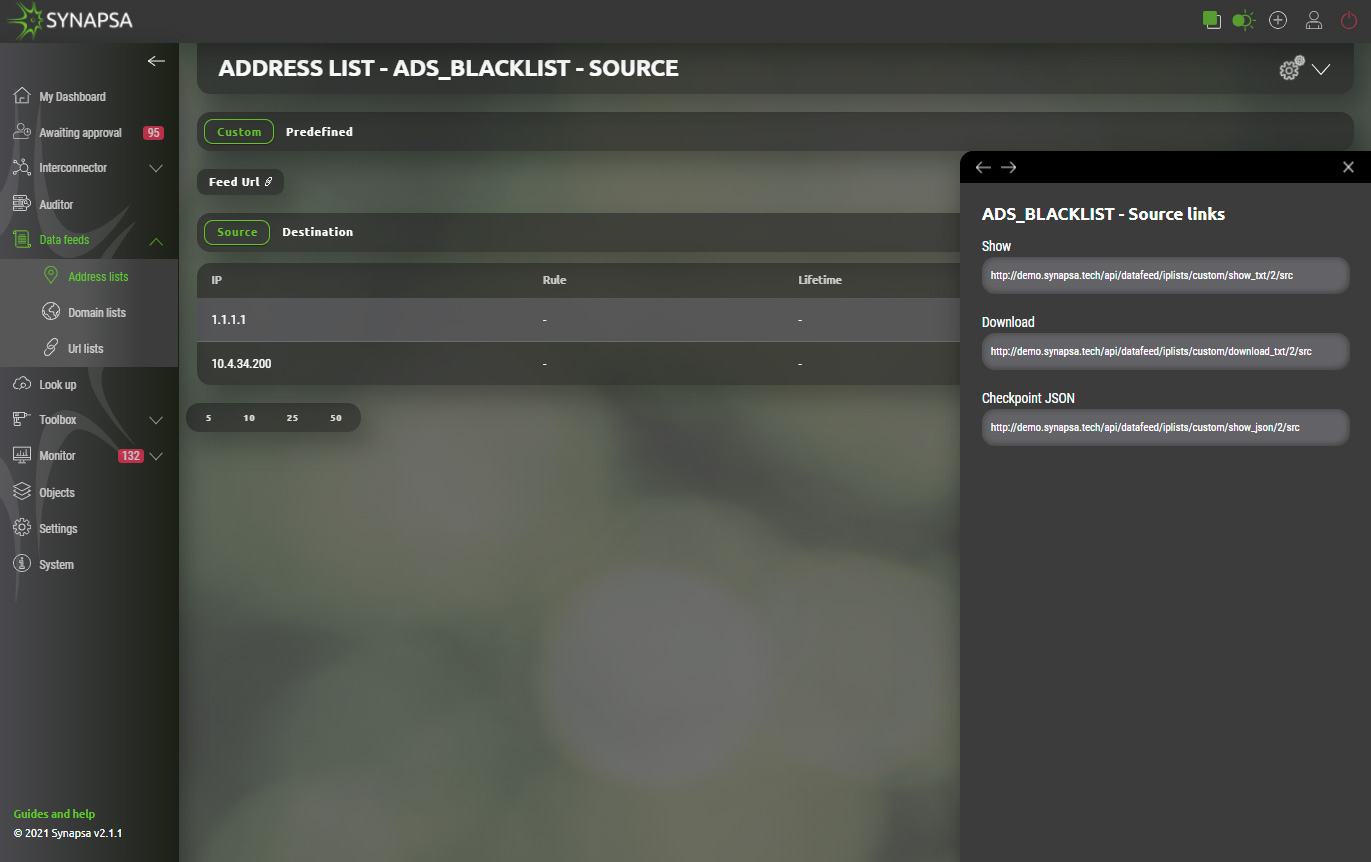
Synapsa administrator can further automate this process by applying aforementioned address lists within Interconnector as specified in same chapter. Source and destination IP addresses don’t need to be inserted manually but will be dynamically updated from specified source or for specific threat. Further on these formalized links will be in return pushed to checkpoint firewall providing fast response in any emerging threats protecting business and company data.
9.3 Domain lists
Domain lists can only contain a valid domain name. All the same rules apply as for Address list. You can create your own lists which will be used as External Dynamic Lists for the devices loading the records into their own configuration.- Custom – List of your own domain entries.
- Predefined – Built-in list of domains.
9.4 URL lists
URL lists can only contain a valid domain name. All the same rules apply as for Address list. You can create your own lists which will be used as External Dynamic Lists for the devices loading the records into their own configuration.- Custom – List of your own URL lists.
- Predefined – Synapsa system has built-in URL lists, which are automatically updated. You cannot modify these lists, but you can use them the same way as user defined lists.
10 Look Up
In this module you can check collected information, e.g MAC addresses, IP addresses, or even CVE`s against services like maclookup, virustotal, shodan, NIST, etc.. Access to these services is through the API key, which must be entered in section Settings - Integration.
10.1 Look Up usage examples
- shodan ip 195.168.14.212
- nist cve cve-2018-11776
- virustotal domain h11034.xyz
- virustotal ip 52.167.249.196
11 Toolbox
11.1 Threat simulator
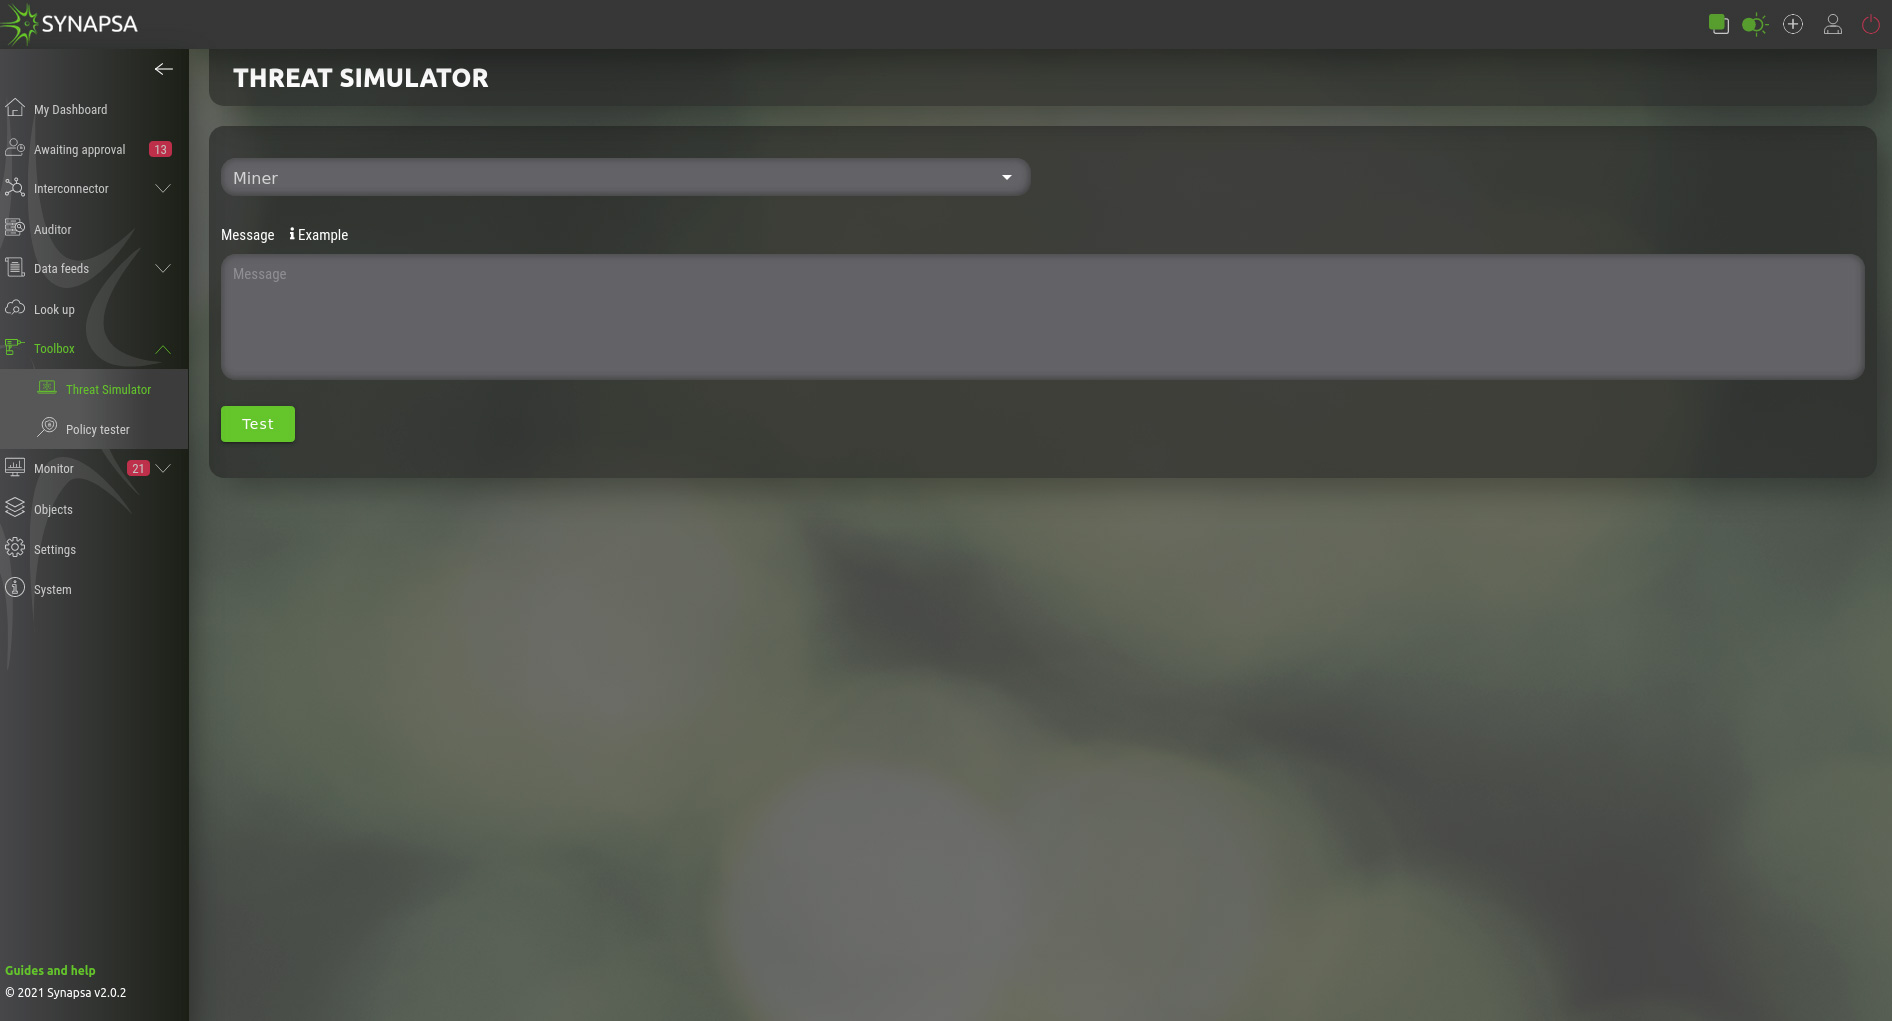
Allows you to simulate the event the same way as it was sent from a specific miner. The event will be stored in the database and processed exactly the same way as the real event. Please use it with caution!
For each miner type there is an example of the event, this is an example for Flowmon ADS Miner:
{ "id": 135284, "time": "2021-07-22 15:51:17", "timeLast": "2021-04-19 08:29:20", "source": { "ip": "5.90.155.7", "resolved": "140.89.117.9.bc.googleusercontent.com", "country": "BR", "blacklisted": 0 }, "techniques": "Exfiltration: Exfiltration Over Alternative Protocol", "type": "ICMPANOM", "subtype": "LargePayload", "nfSource": { "id": 2, "name": "Default", "virtual": 0, "location": "localhost" }, "batch": null, "flowStamp": "2021-04-19 08:26:32", "detail": "A large payload of ICMP packets has been detected. Payload: 60.004 B, number of packets: 13155, ICMP type: 0, median of the payload in the network: 60B.", "targets": [ { "ip": "95.11.123.236", "resolved": "", "country": "LAN", "blacklisted": 0 } ], "perspectives": [ { "id": 6, "name": "perspective_6", "priority": 3 }, { "id": 7, "name": "perspective_7", "priority": 3 }, { "id": 8, "name": "perspective_8", "priority": 5 } ], "priority": 5, "interest": 789300, "comments": [], "attributes": { "ports": [ 0 ], "median": 60, "average": 60.004, "bytesIn": 0, "flowsIn": 0, "timeEnd": 1618813652750, "bytesOut": 789300, "flowsOut": 1, "iCMPType": 0, "packetsIn": 0, "protocols": [ 1 ], "timeStart": 1618813592015, "packetsOut": 13155, "durationMax": 60735, "durationMin": 60735, "targetCount": 0, "flowsSingleIn": 0, "flowsSingleOut": 1 } }
You can use it as a template and modify it as needed.
11.2 Policy tester
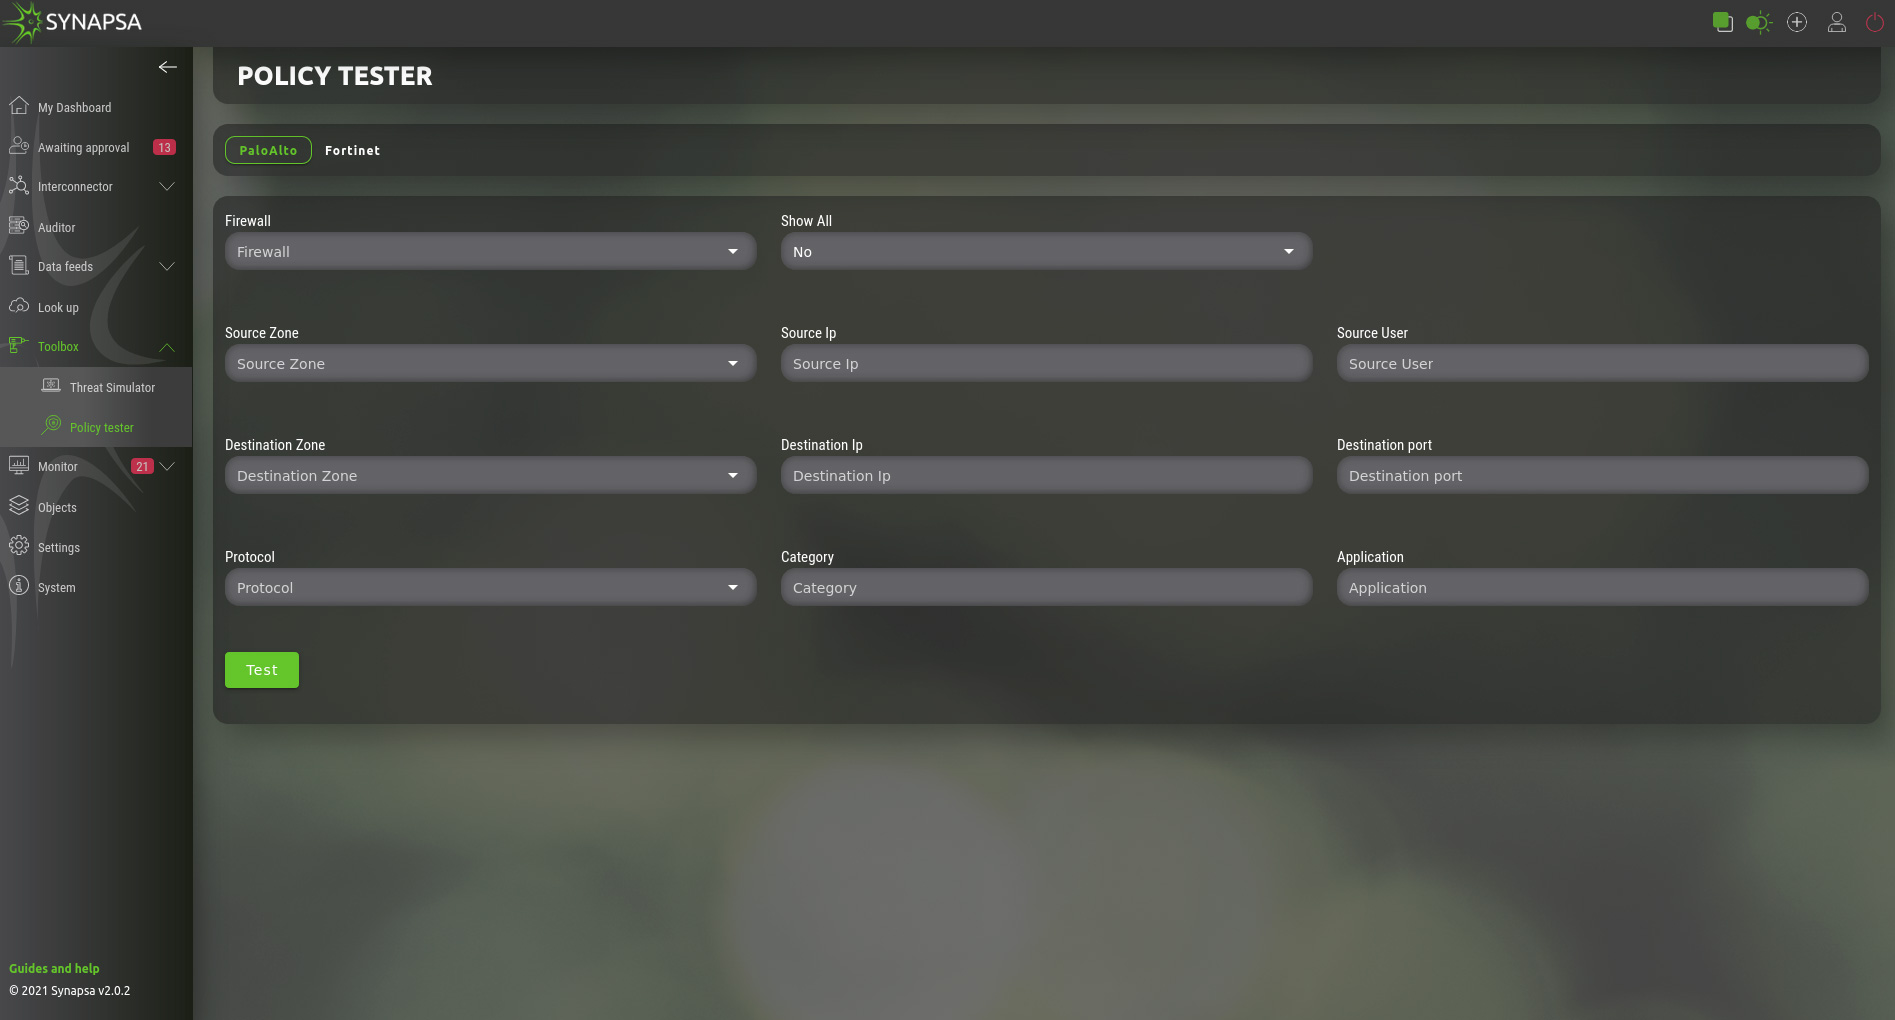
Allows you to test what security policy will match the connection with specific parameters. Select a firewall you want to send the test request to and fill out all the required fields.
This module identifies rules on specific firewalls that would be captured by those tested in real traffic.
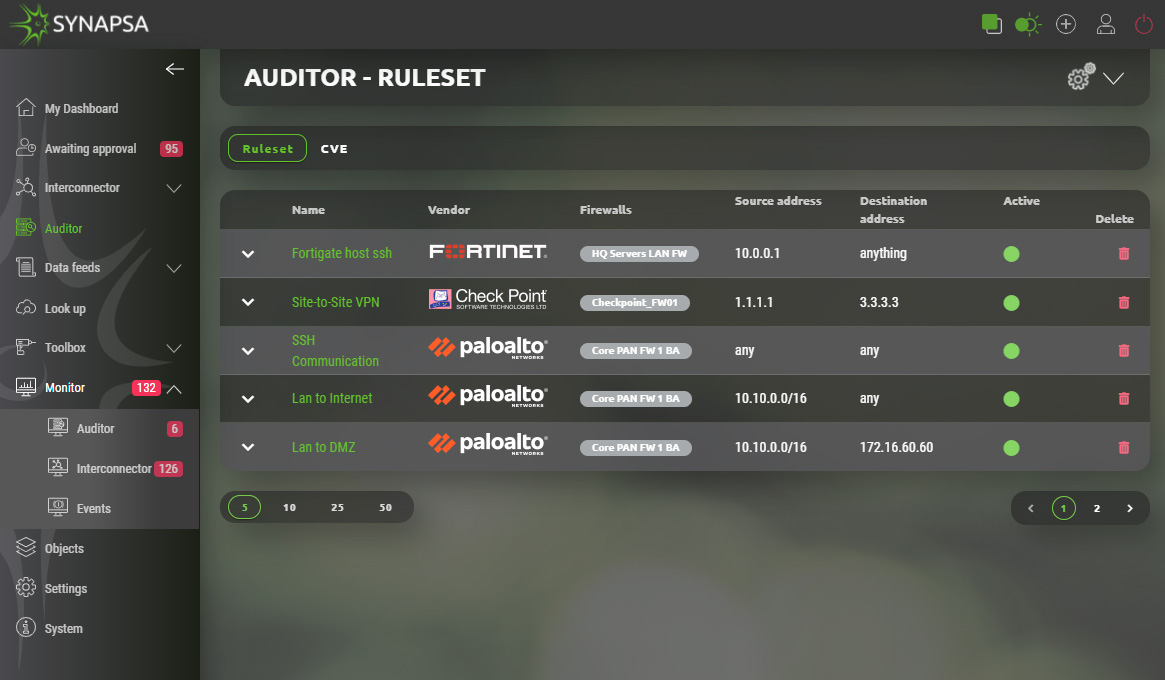
12 Monitor
12.1 Auditor
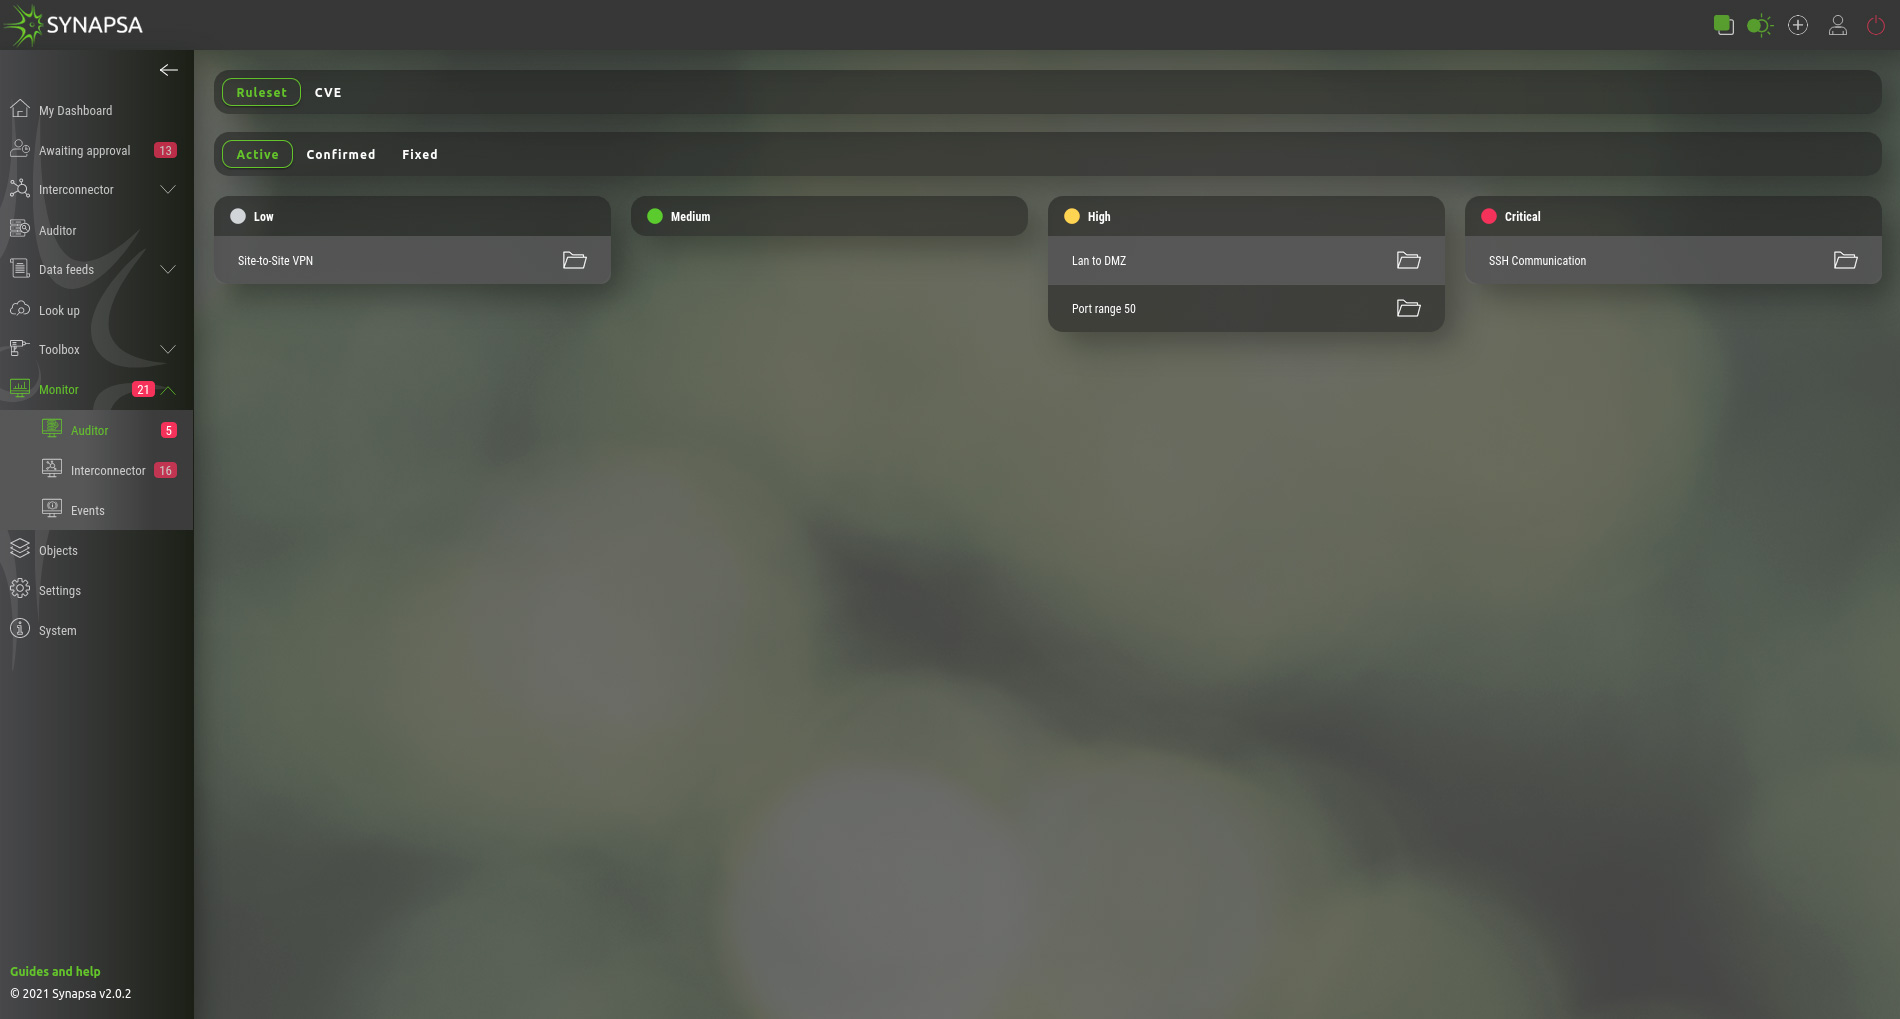
This section will display results based on Auditor rules. They are separated into few categories, as mentioned below.
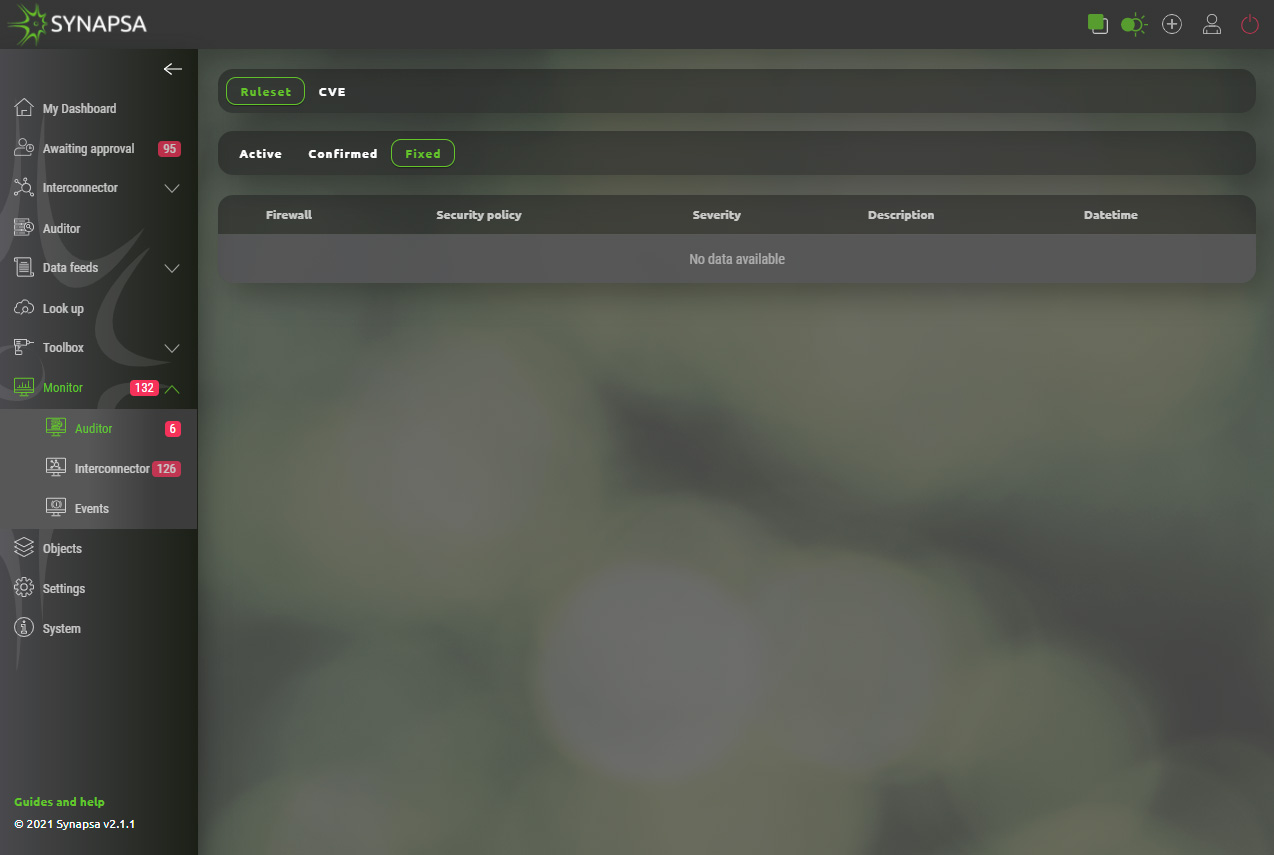
- Ruleset – Graphical presentation of active auditor policies, based on severity. By Clicking on a specific alert, you can confirm and move it to Confirmed. By clicking on Fix button, you can fix this policy on firewall using API call.
- CVE – Each CVE has a complete description, solution and mitigation steps, which comes directly from the vendor's CVE feed.
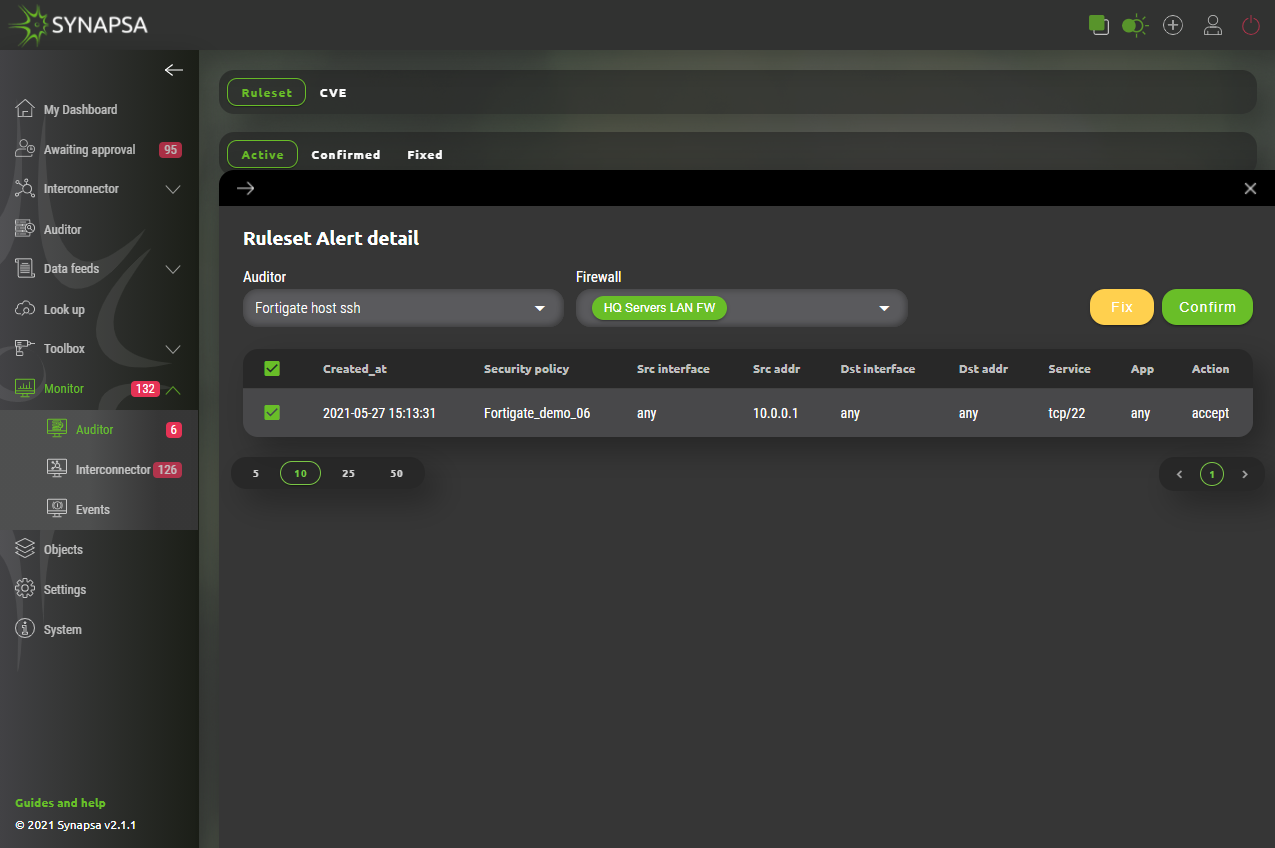
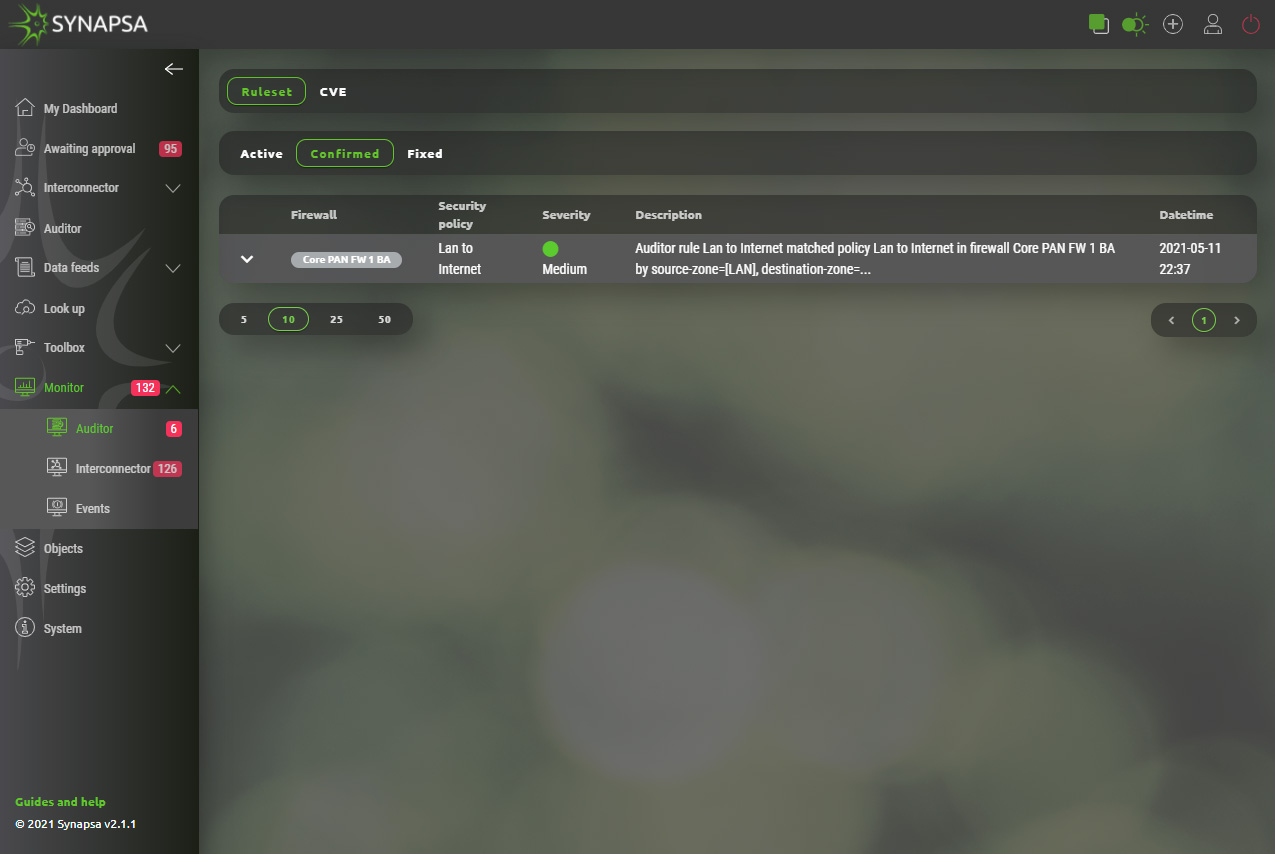
Alert contains matched values from Auditor’s configured Ruleset including it‘s name, all matched values which triggered it and two options how to handle it. Administrator of Synapsa can either:
- Fix – Disable firewall rule directly from synapsa using API calls.
- Confirm – Acknowledge such event which will move it to „Confirmed“ subsection.
12.2 Interconnector
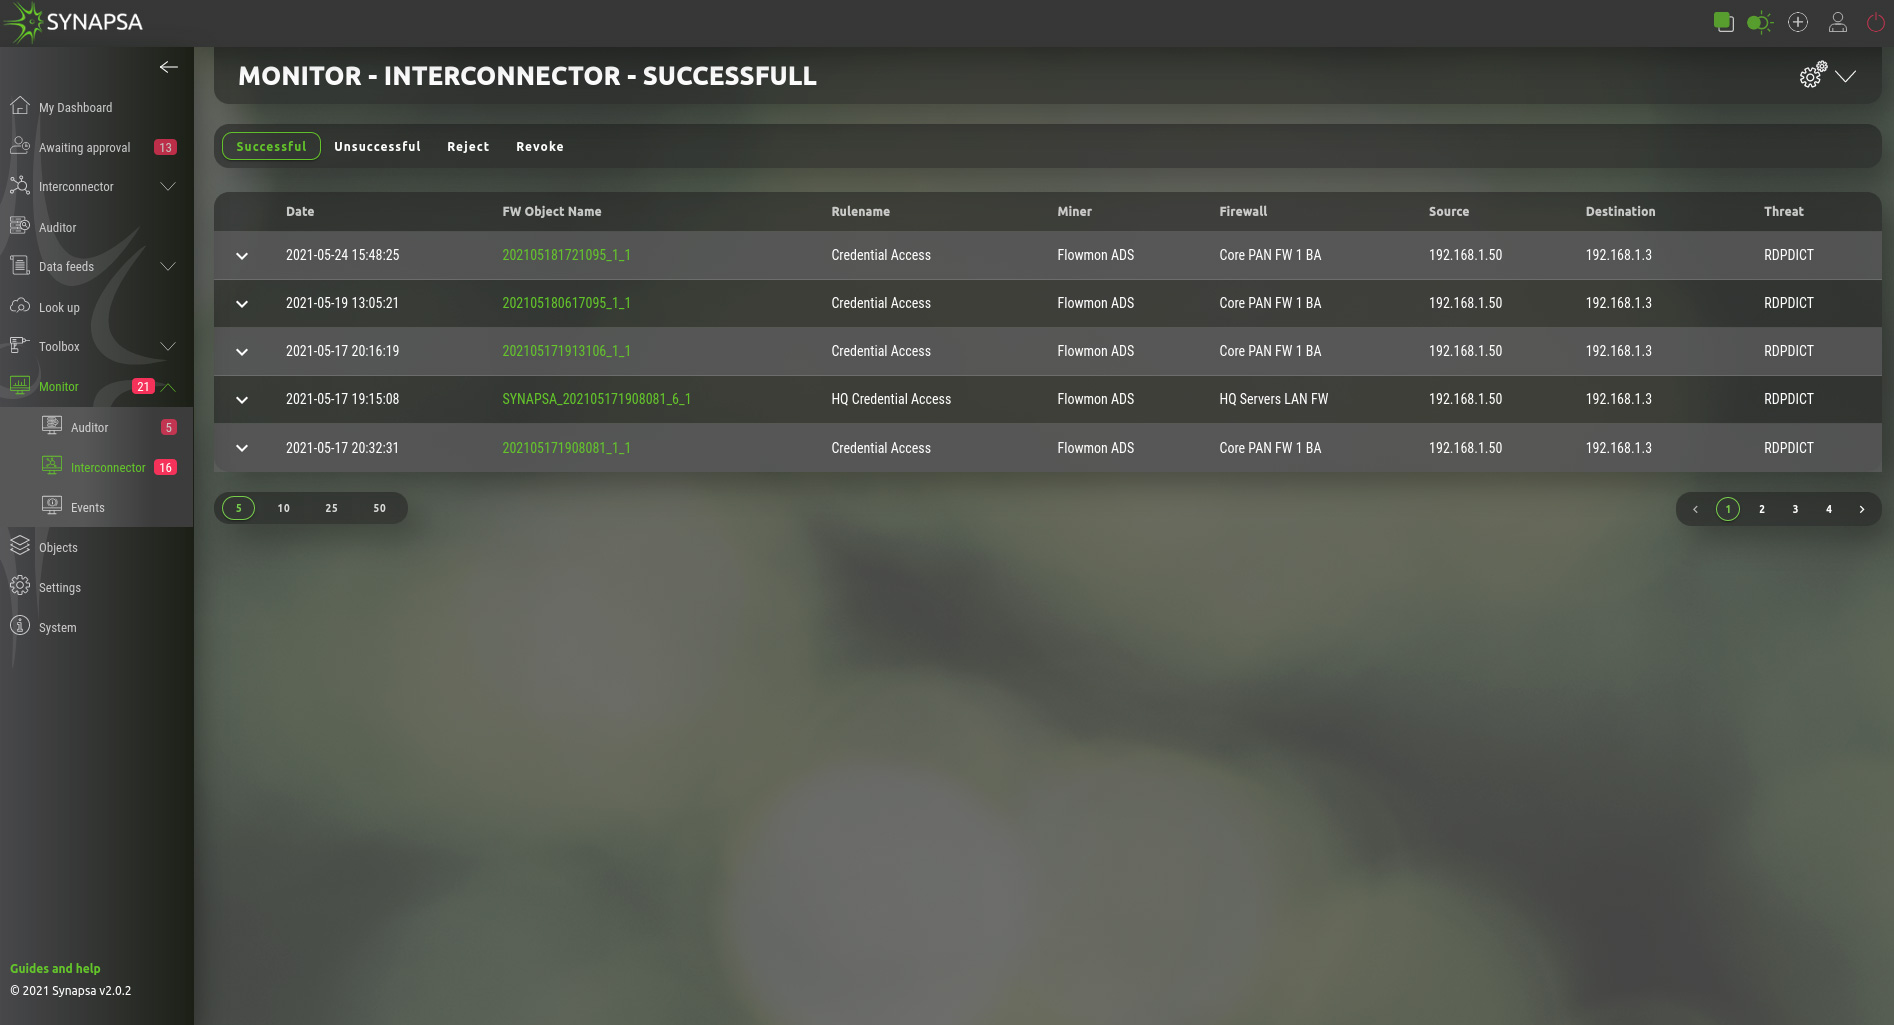
Contains all results from security policies, in four categories.
| Successful | List of the successfully created security policies on the firewalls based on the configured Synapsa rules. Each API call is considered to be successful, if API code and response message matches the value configured for the call in SYSTEM->API. |
| Unsuccessful | List of API calls which have a different value than expected. The whole call sequence is considered as not successful if at least one of the call has a non expected response. |
| Reject | Logs of the prepared security policies which were rejected manually by a Synapsa operator. This only applies on rules type “On Approval”. |
| Revoke | Logs of the successfully created security policies which were later revoked by a Synapsa operator. This applies on both rule types “Automatic” and “On Approval”. |
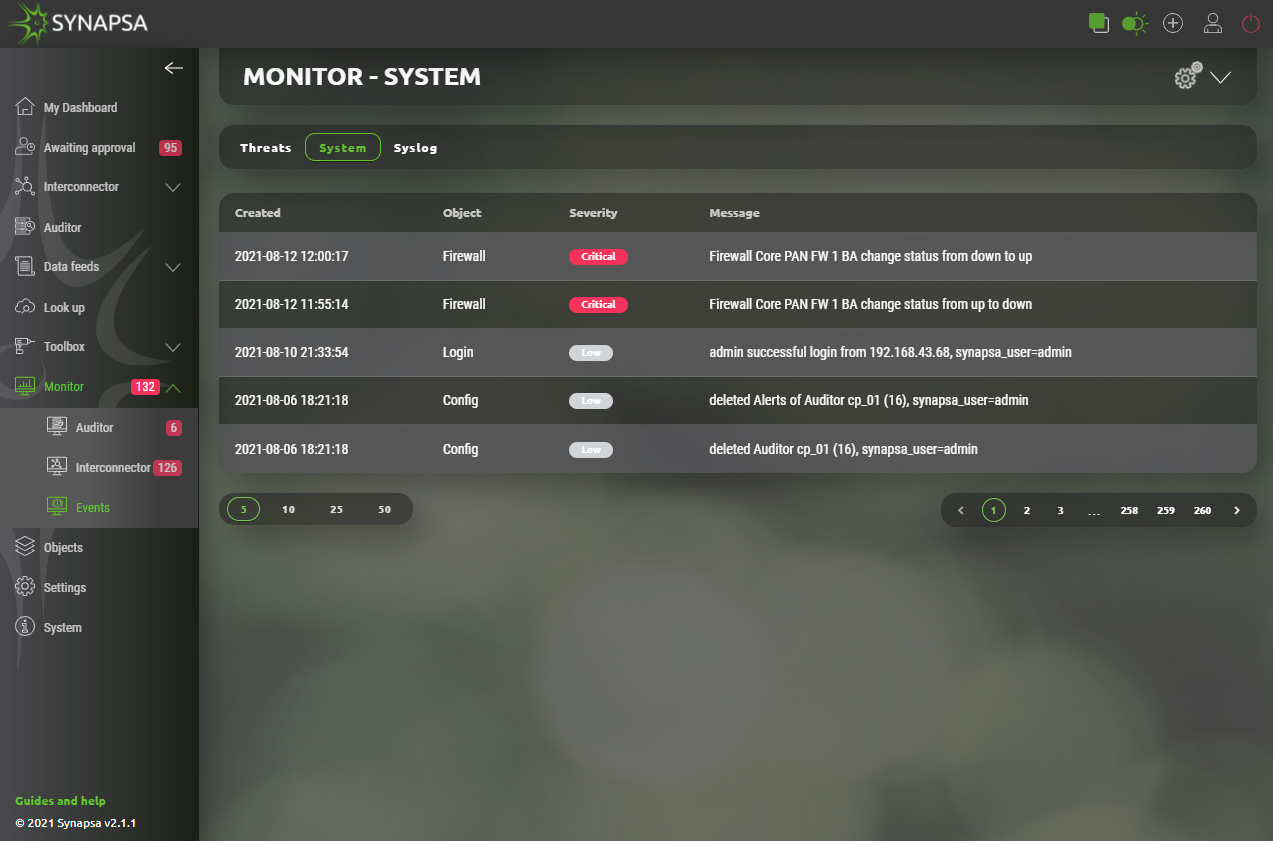
12.3 Events
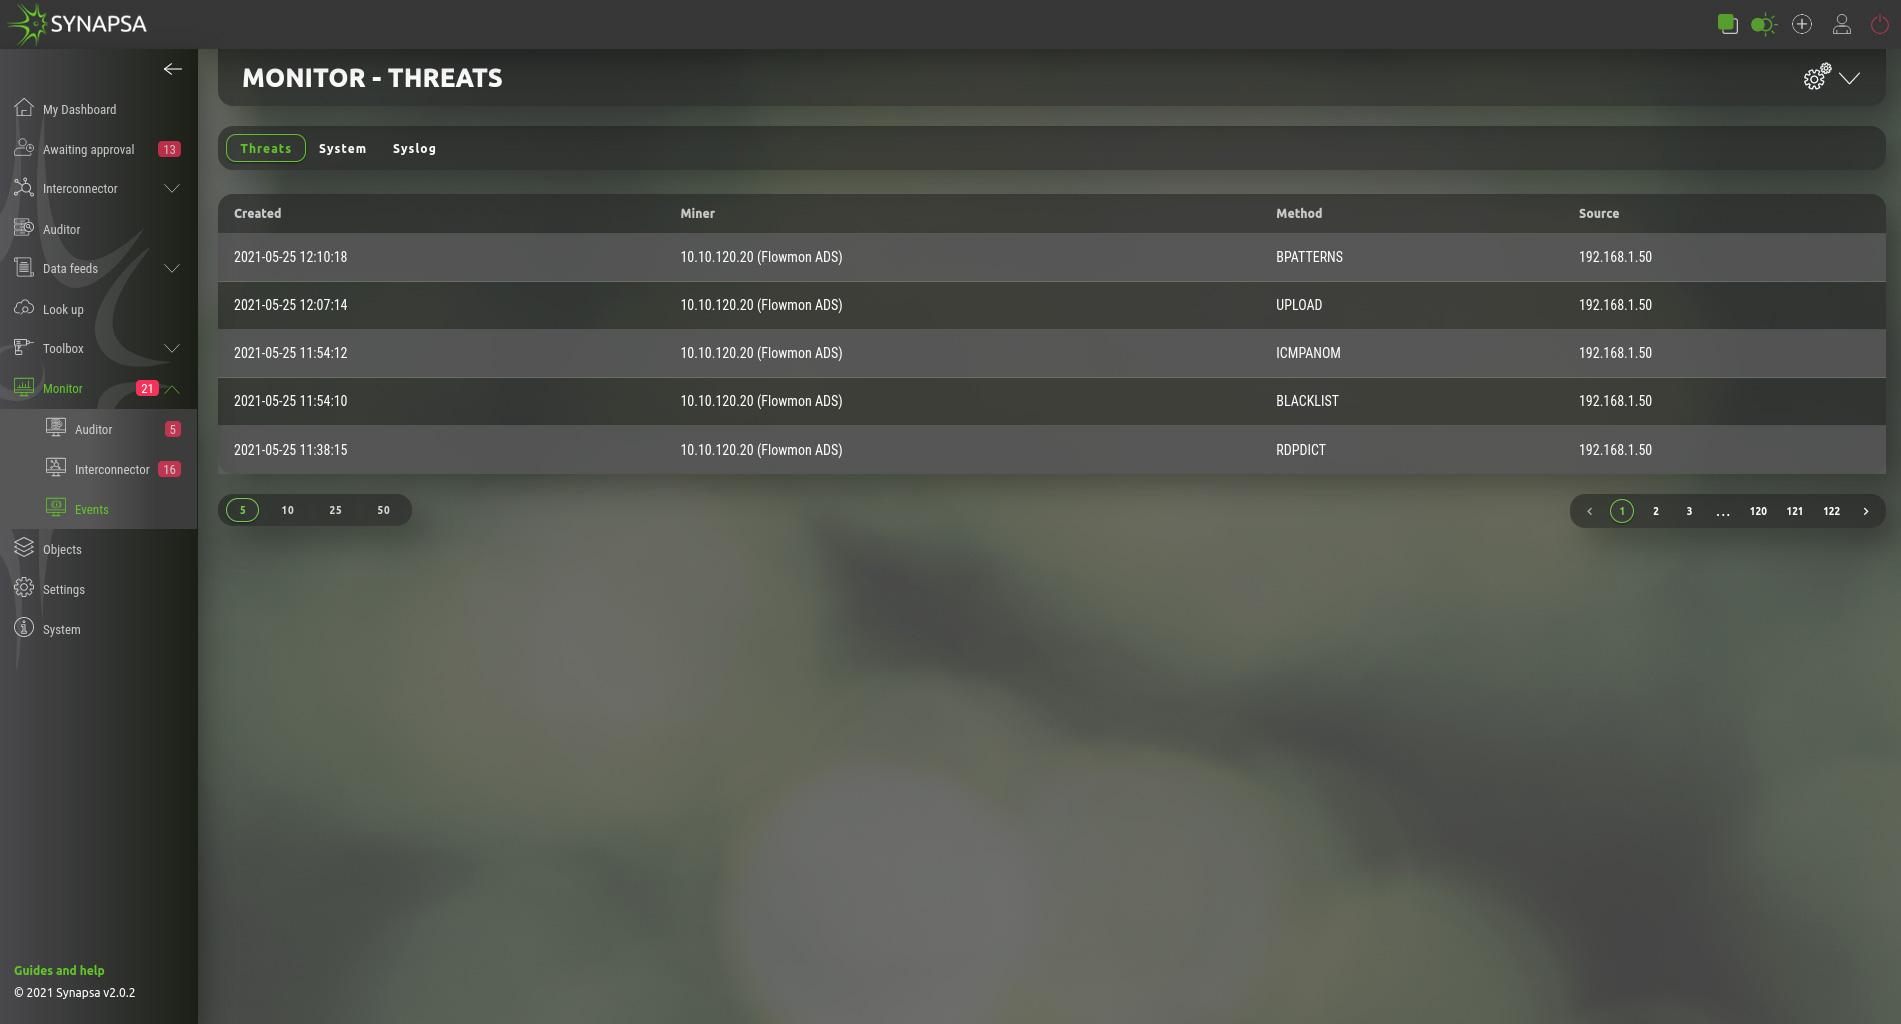
The events are used to determine the status of the individual parts of the Synapsa.
- Threats – Received threats from miners.
- System – Information about system activities, e.g. user login, rule change, firewall status change, etc.
- Syslog – Received syslog messages.
13 Objects
Synapsa Objects section provides configuration of elements that are related to management of system itself. They are used to define other systems and services.
13.1 Emails
Emails – Email addresses list which can be assigned to a notification profiles.
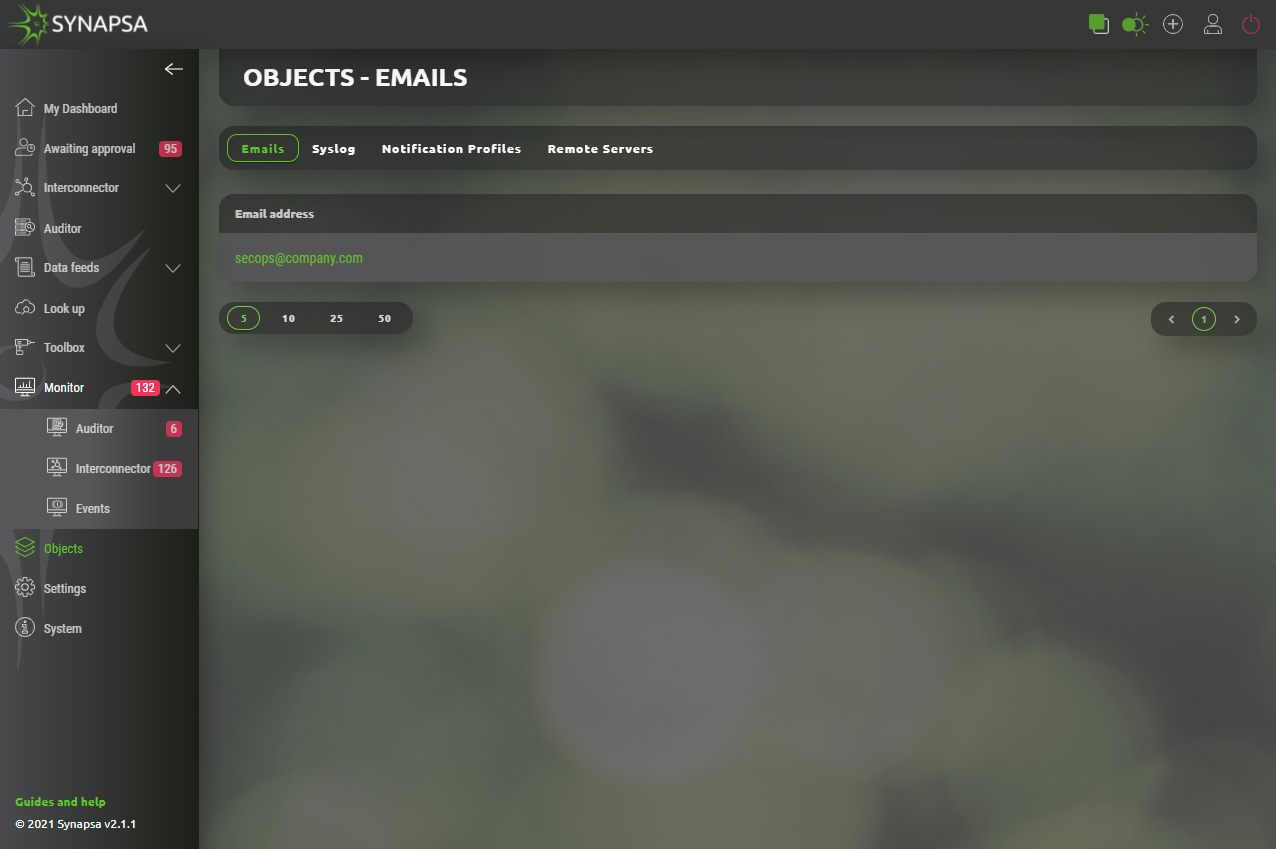
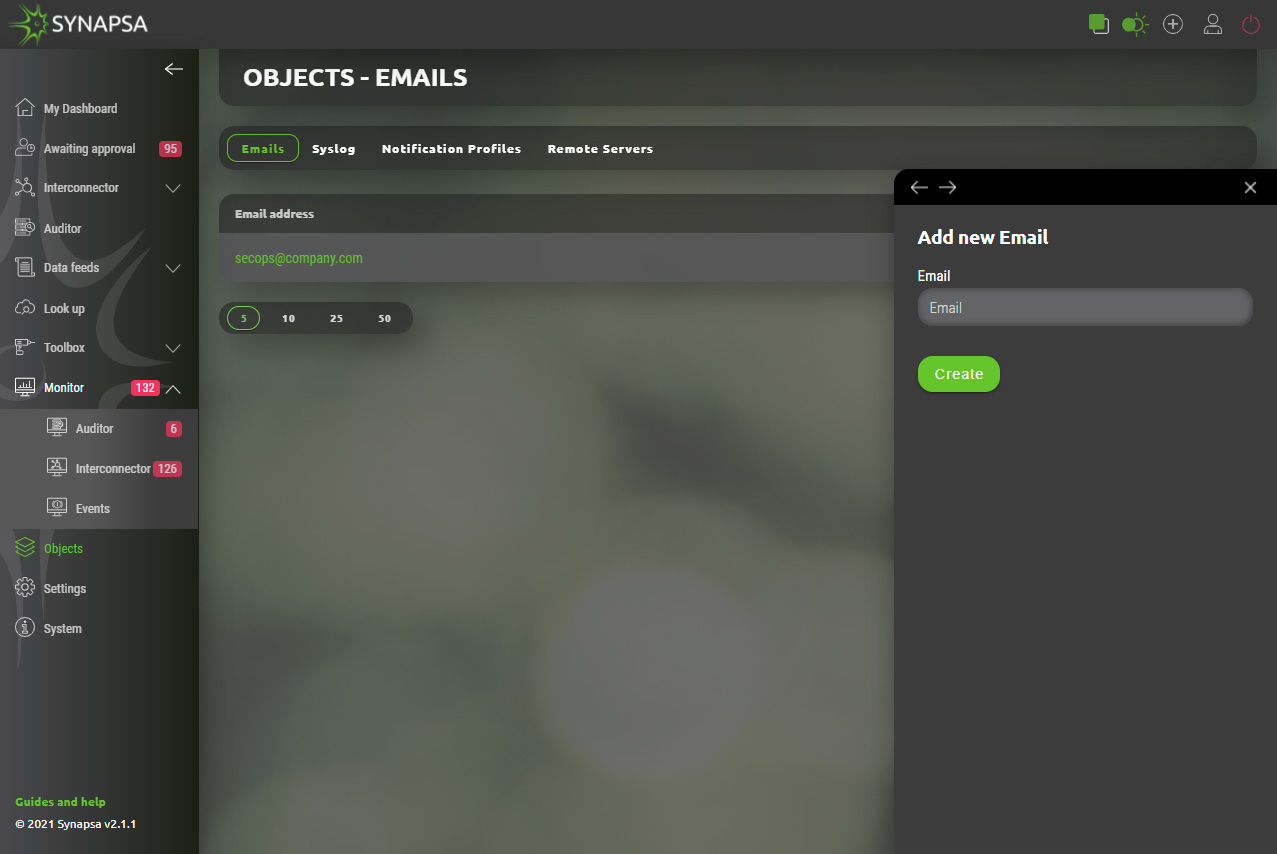
13.1.1 Emails configuration
User can easily add email addresses that can be used within system.
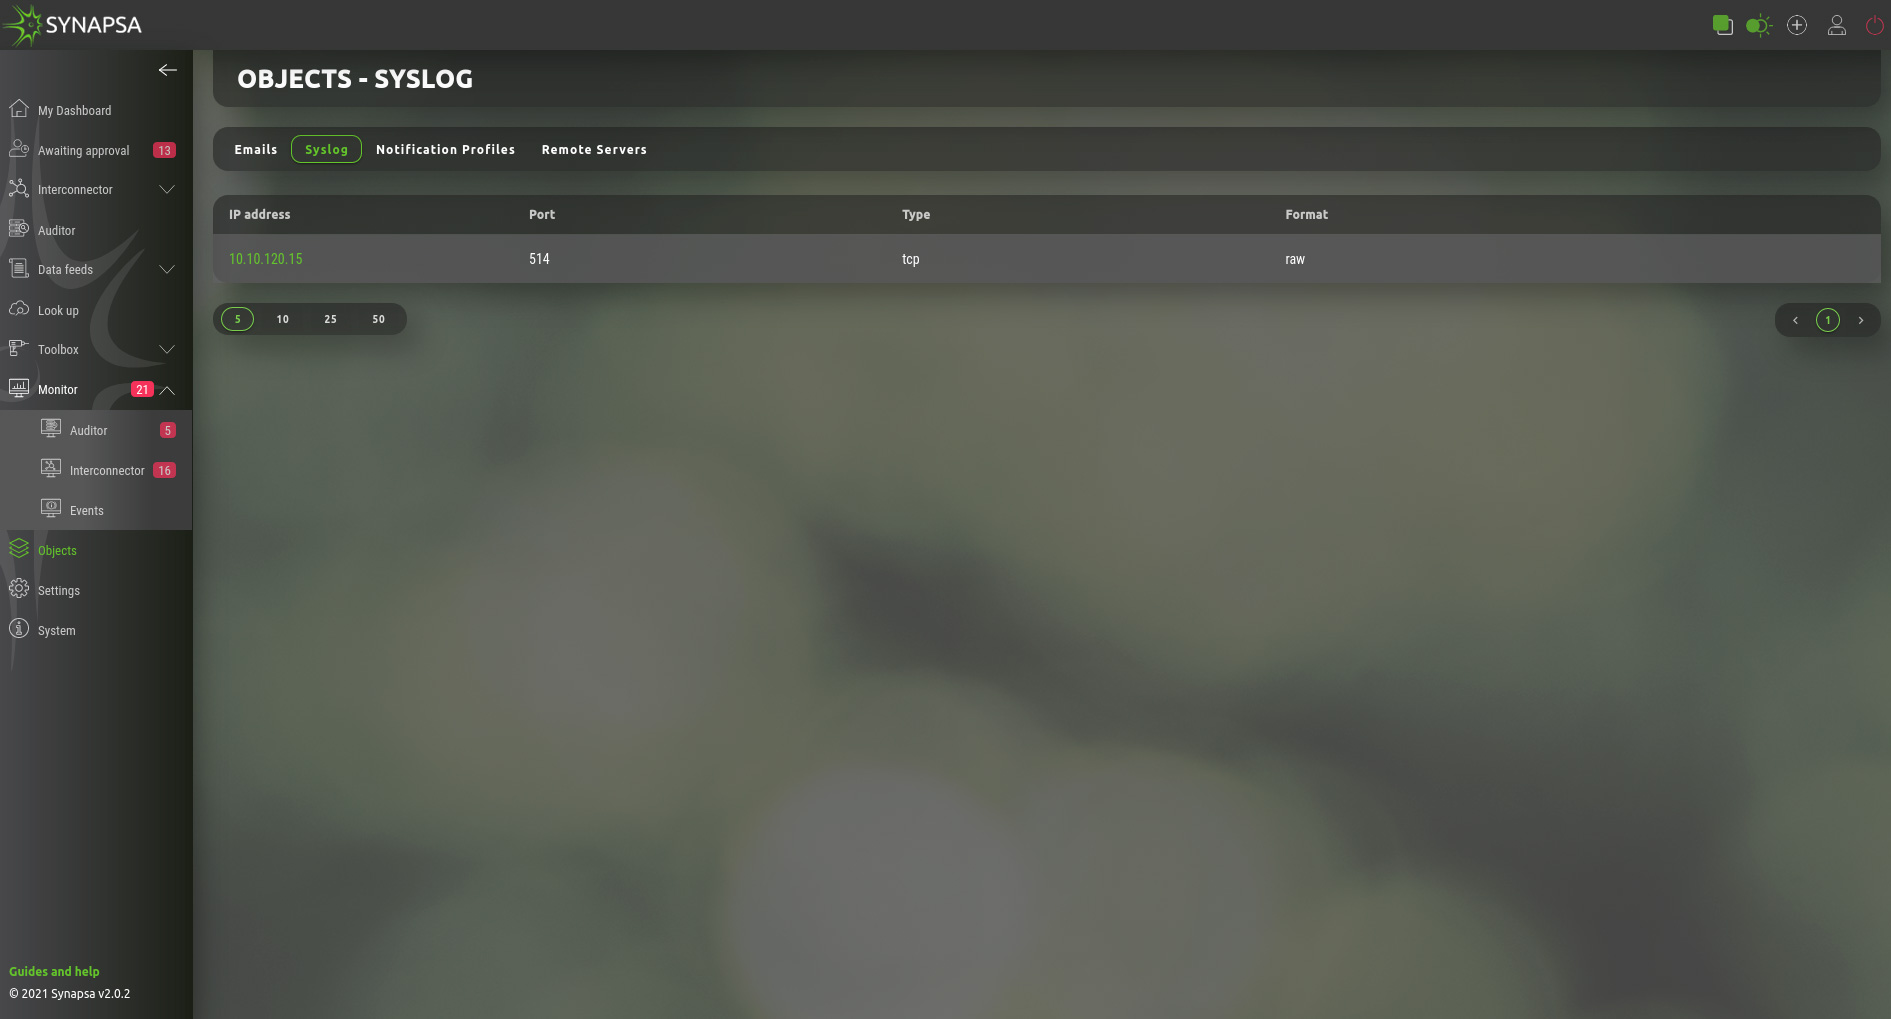
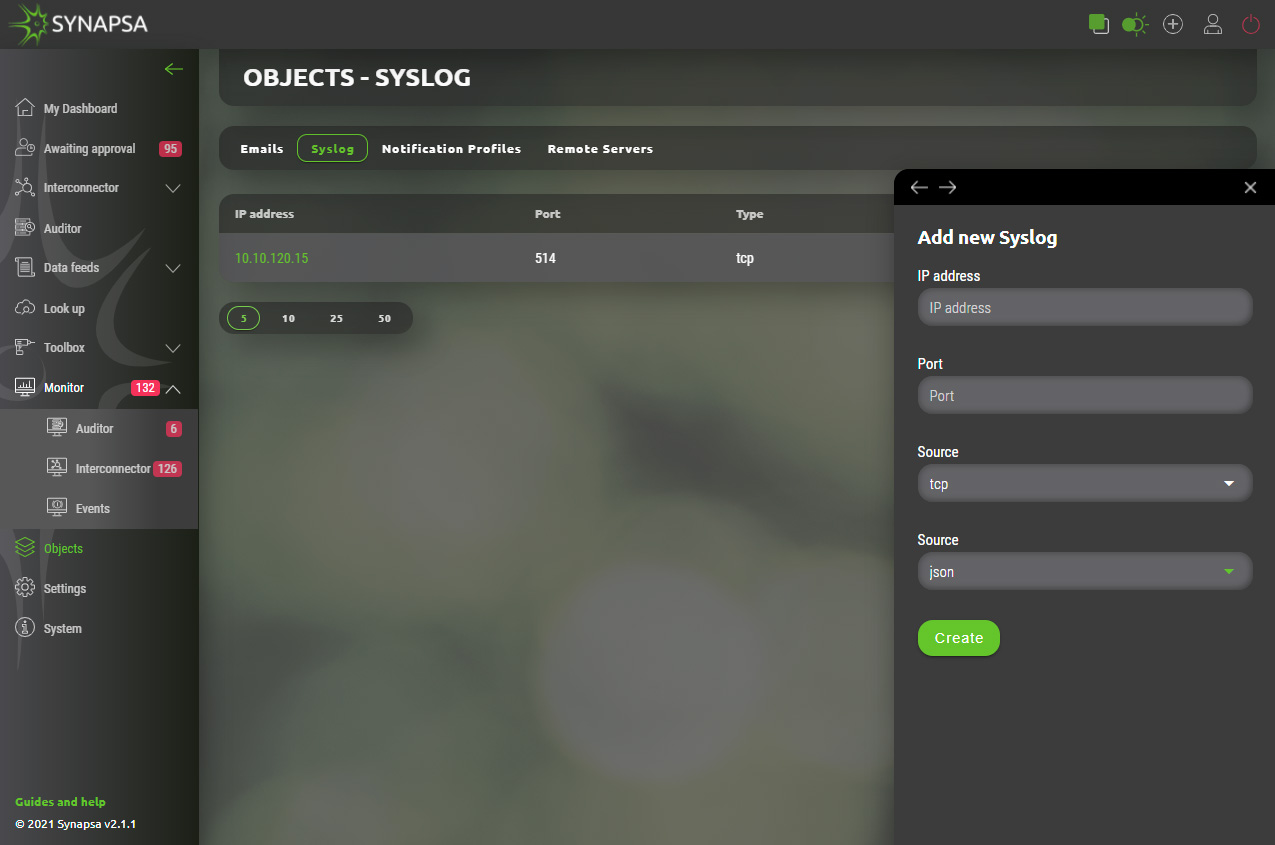
13.2 Syslog
Syslog – List of syslog servers, which can be assigned to notification profiles. You can specify a format of syslog messages sent by Synapsa.
- RAW – Syslog payload will be a plain text as it is logged in the local syslog events.
- JSON – Syslog payload will be JSON formatted.
Note: These are servers that Synapsa will send notification to, it can be the same miner Synapsa received syslog from, then after the Threat mitigation ,it will notify the miner back. This is used mostly with SIEMs.
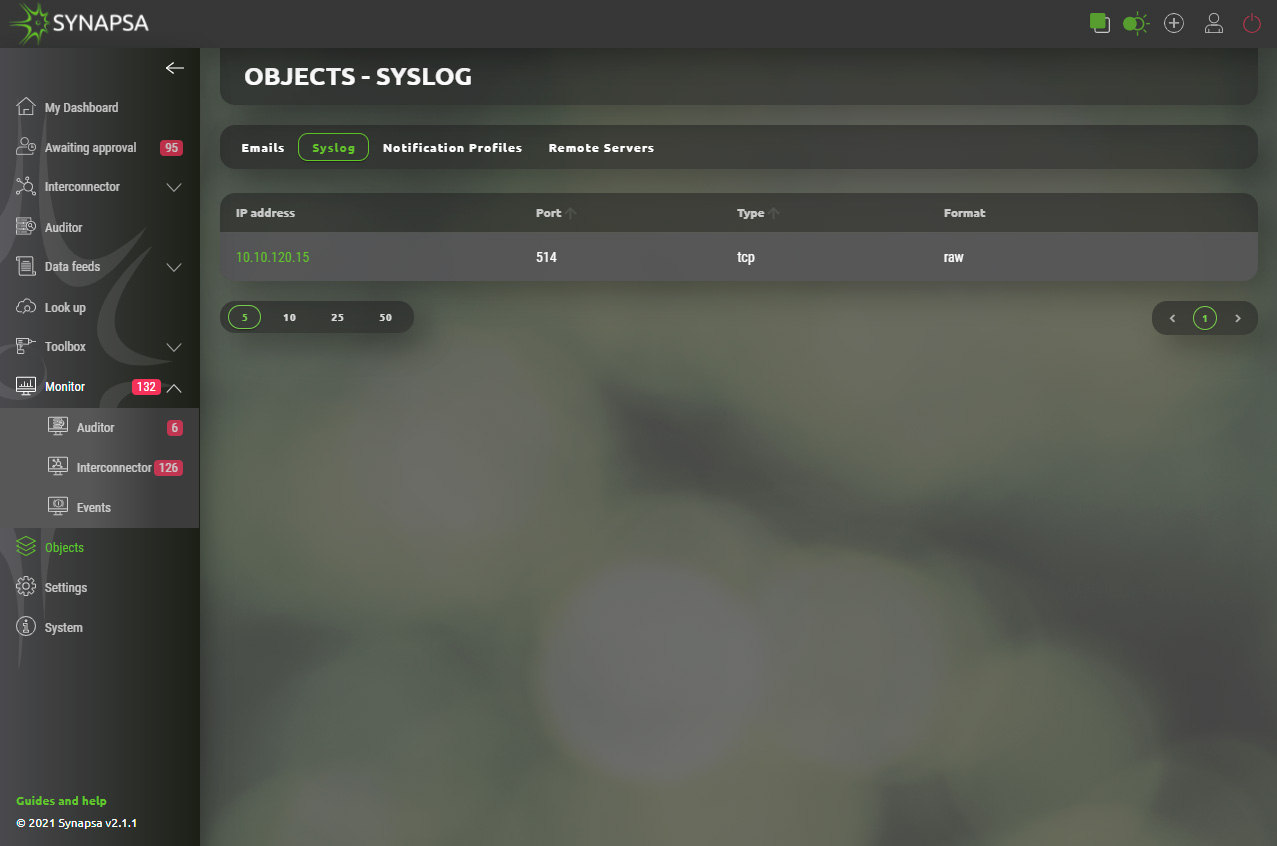
13.2.1 Syslog configuration
Required server(s) that will receive logs from Synapsa system can be added by providing basic parameters.
- IP address – Address of destination server.
- Port – Network port number that destination server listens on.
- Type – Specification for type of traffic used for transport. Valid options are TCP or UDP.
- Format – Style in which data will be presented. Valid options are JSON or RAW.
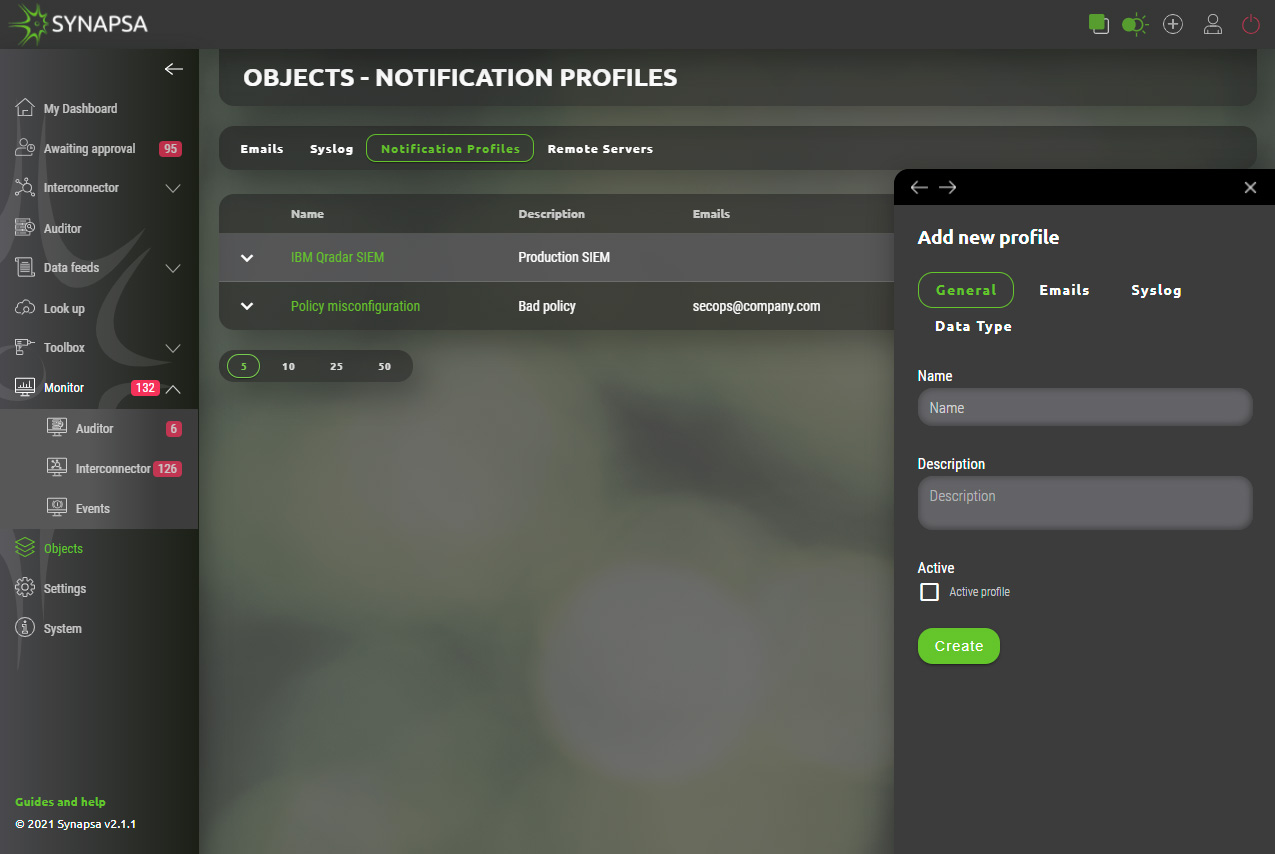
13.3 Notification profiles
In notification profile you can select existing emails and syslog server, customize the message Synapsa will send in the body and the Objects and Severities which will be notified. You can have as many profiles as you need.
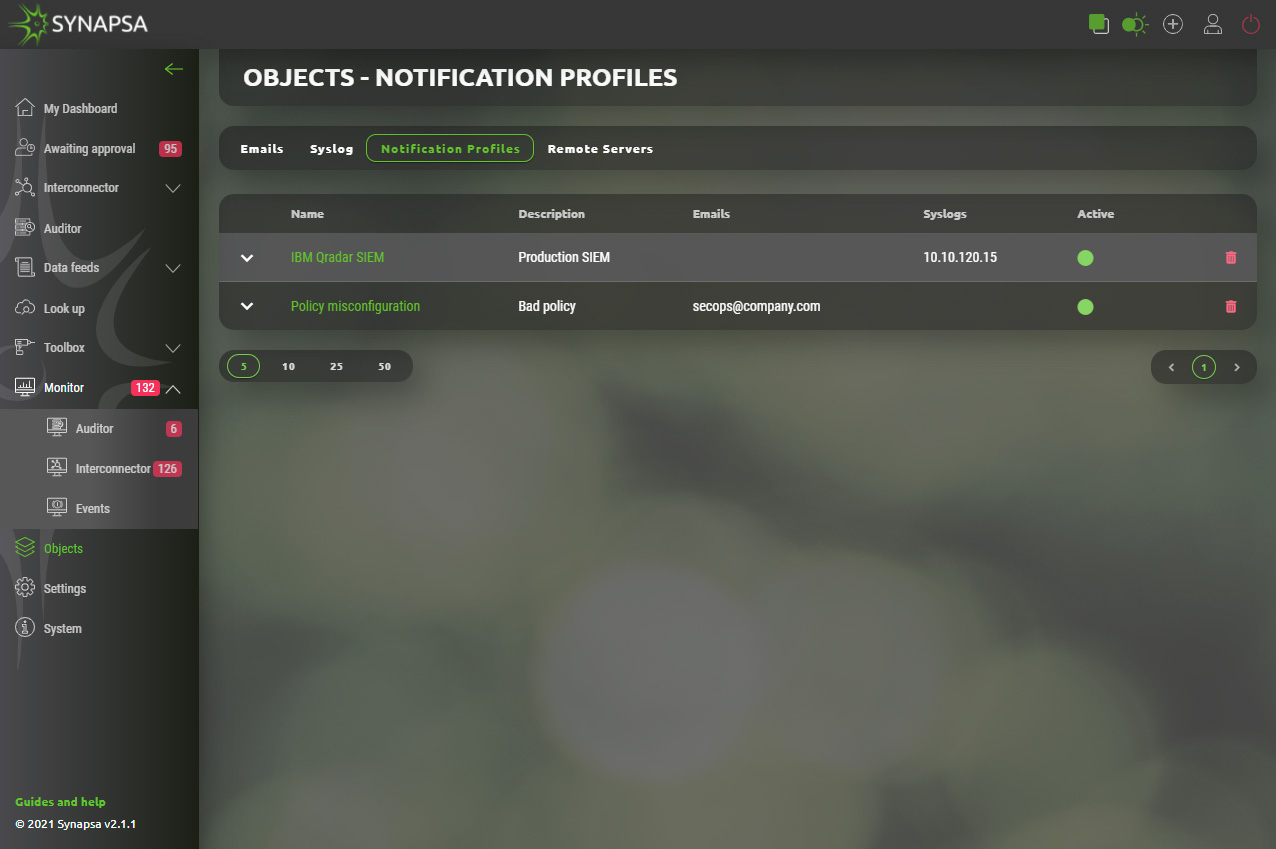
13.3.1 Notification profiles configuration
Configuration can be easily created by selecting required email(s) and syslog(s) from existing list.
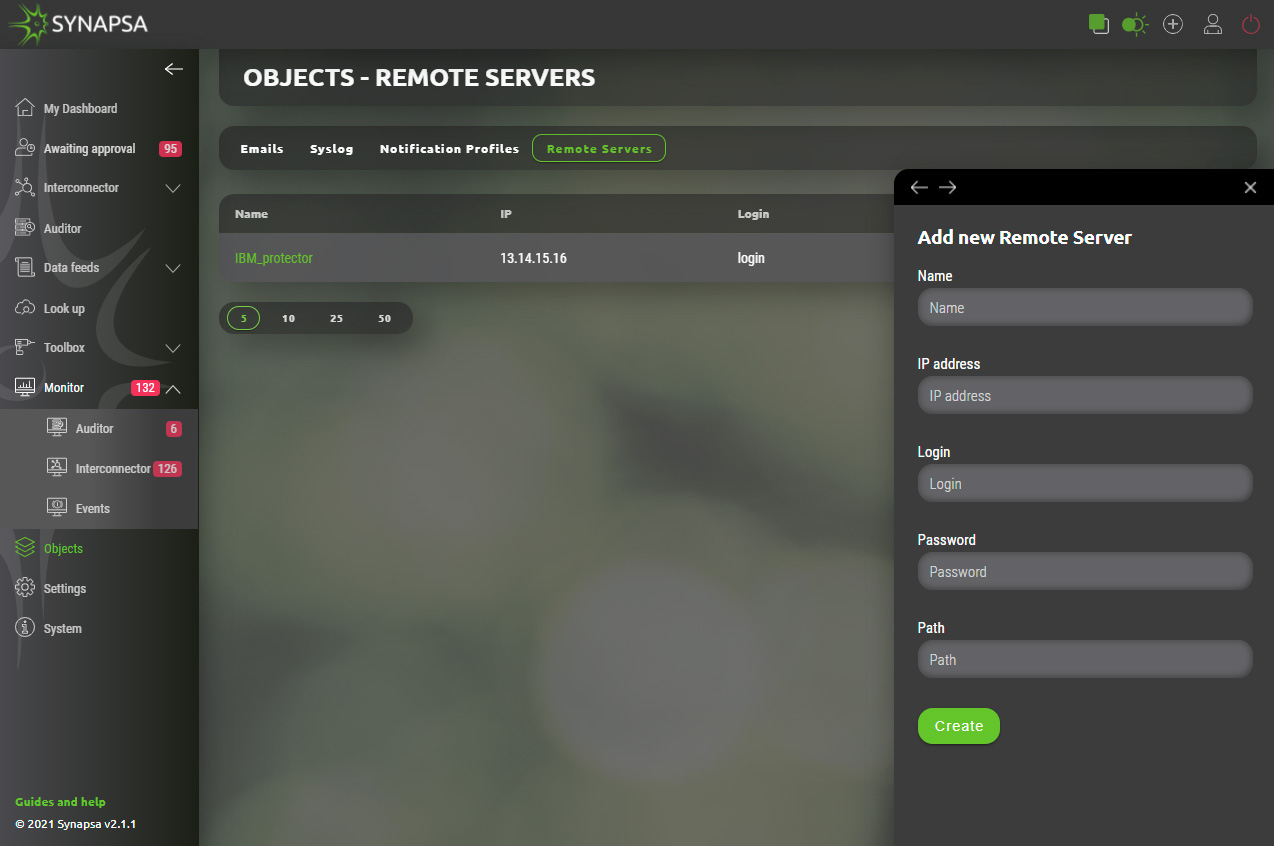
13.4 Remote servers
Create remote servers to backup your data elsewhere in XML format.
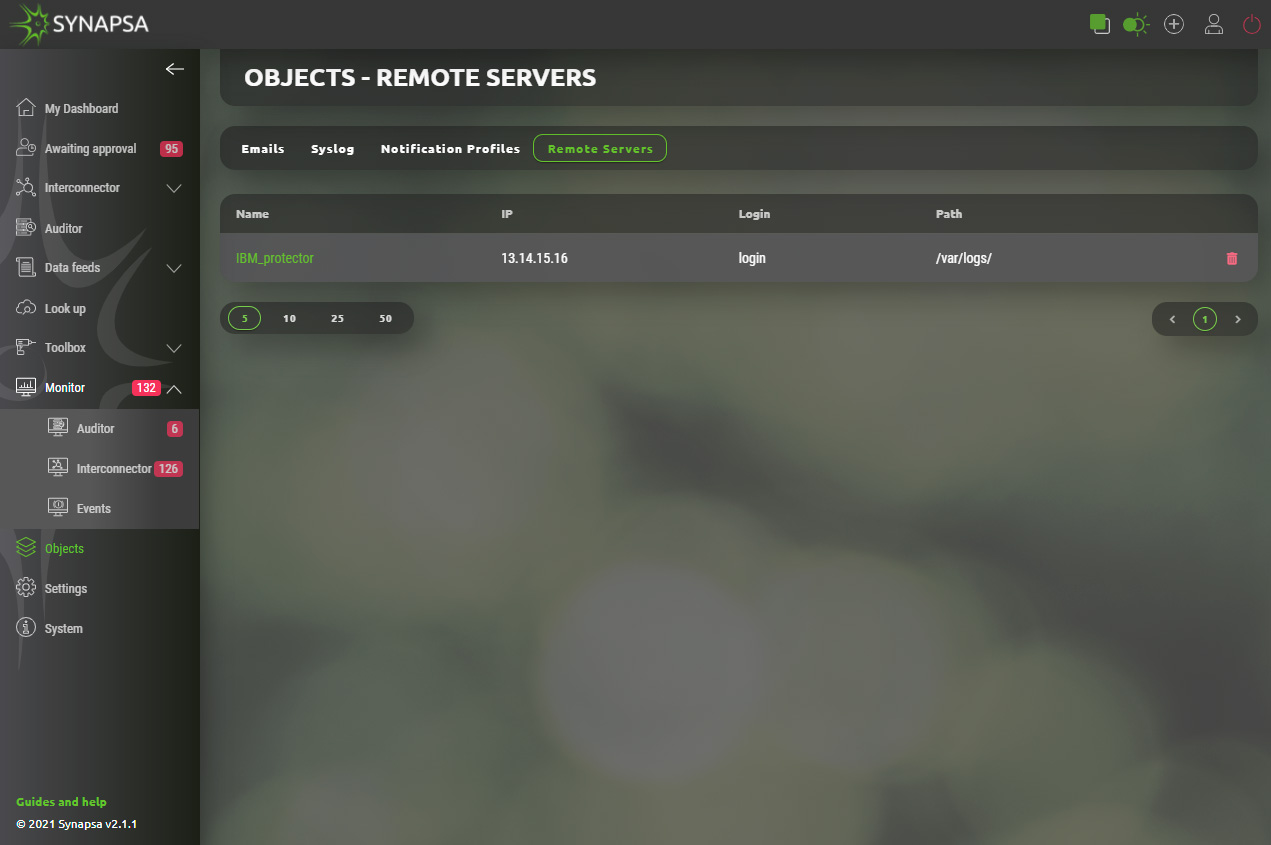
13.4.1 Remote servers configuration
Required backup server(s) can be added by providing basic parameters.
- Name – Identification of backup server.
- IP address – Address of destination server.
- Login – Username that provides authentication on remote server.
- Password – Password for remote authentication.
- Path – Existing path on destination server that can be used for backup files.
14 Settings
In this section you can set up all components, used in rules and you can also modify some communication parameters.
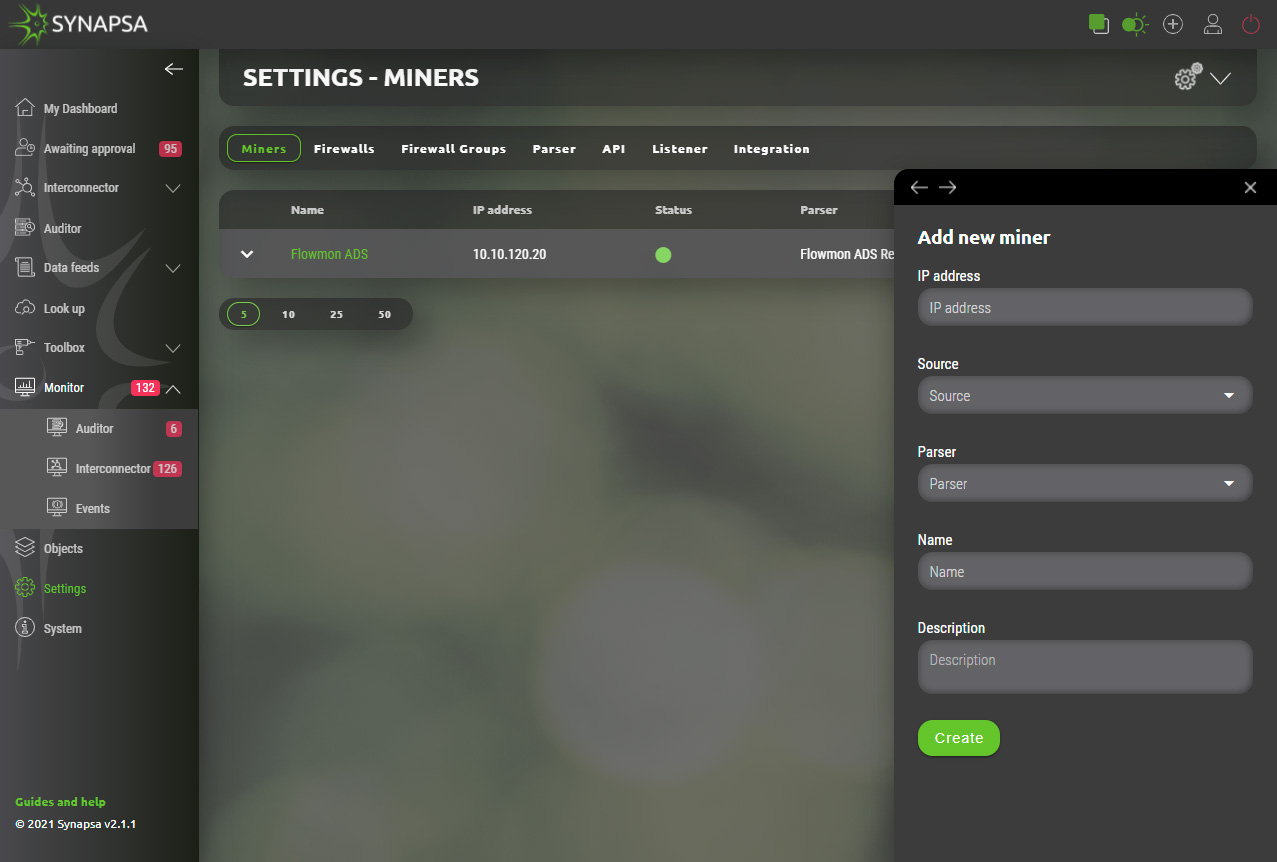
14.1 Miners
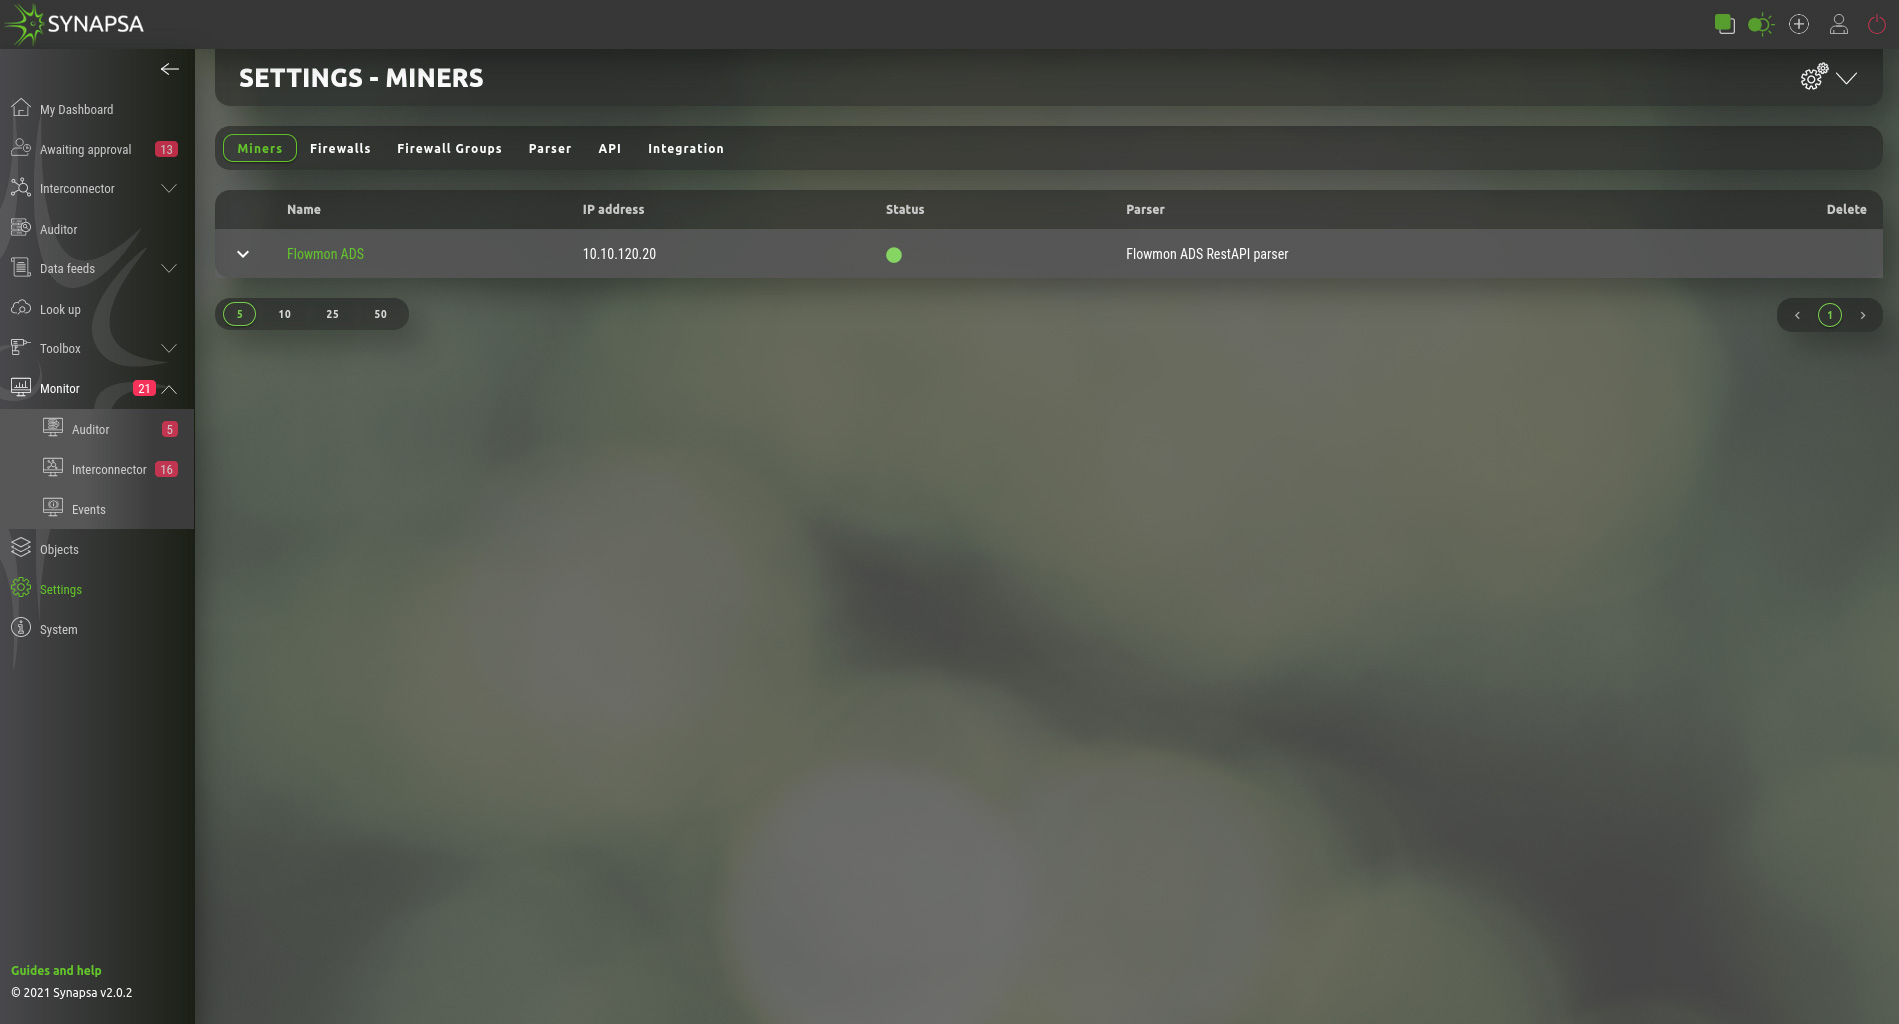
Miner is a log source for the Synapsa system. By adding a new miner you open TCP and UDP port 514 for the IP specified as a miner IP Address.
All the received logs from the miner are stored but only processed when there is an existing Rule which uses the miner as input for further processing.
If there is no Rule to process threats reported from a specific miner, syslog will be automatically deleted from "All syslog" database, based on the automatic task which can be configured under System -> Tasks
Configuration requires following parameters.
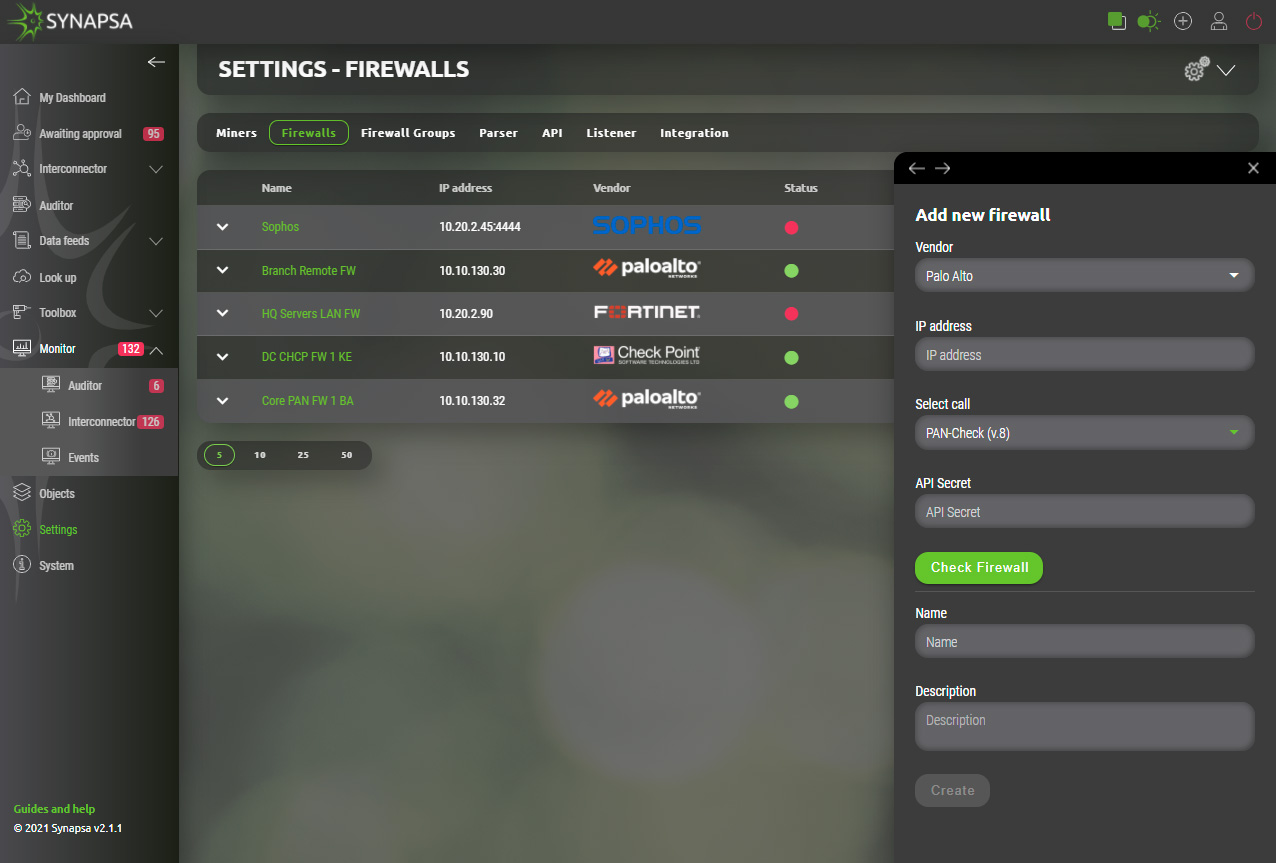
14.2 Firewalls
API key has to be already generated and key needs to have permissions to perform all the necessary operations on the firewall.
You can only add a new firewall if the check is successful. Check button will connect to the firewall IP address and perform a simple API call. This only checks the connectivity and the key, however does not check all the permissions. Make sure the API key is able to modify configuration.
Configuration can vary based on vendor and type of firewall to be added. Configuration menu is in the foreground of the screen which allows user also to see currently configured firewall in the background.
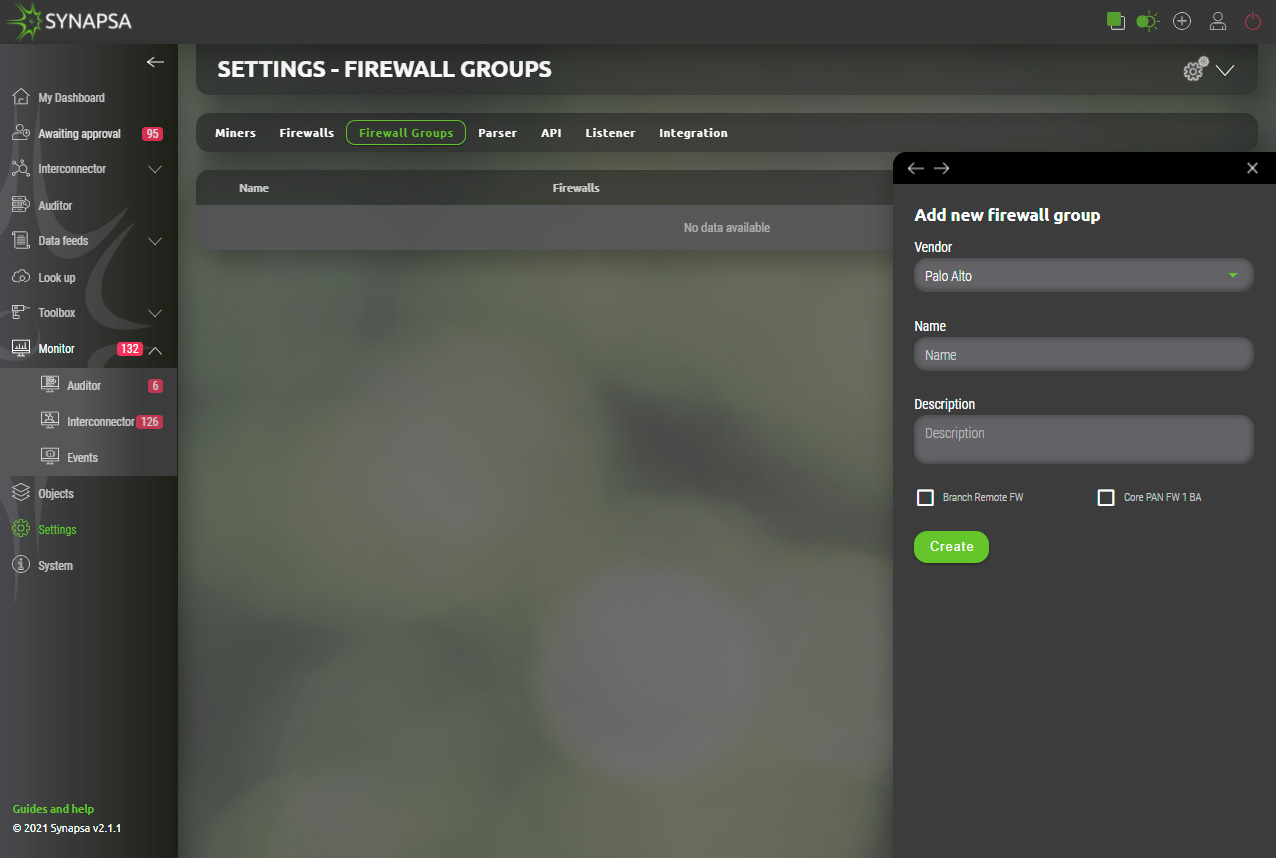
14.3 Firewall groups
You can group the firewalls under groups, to be able to assign the whole group to a Synapsa rule for Interconector and Auditor rules.
Configuration dynamically provides only managed firewalls for chosen vendor.
14.4 Parser
Parser is a set of regular expressions which are used to parse a raw syslog message into variables which are used for creating a security policy. You cannot modify a built-in parser, but you can select what Threats you want to process in a Rule where a miner having a specific parser is used.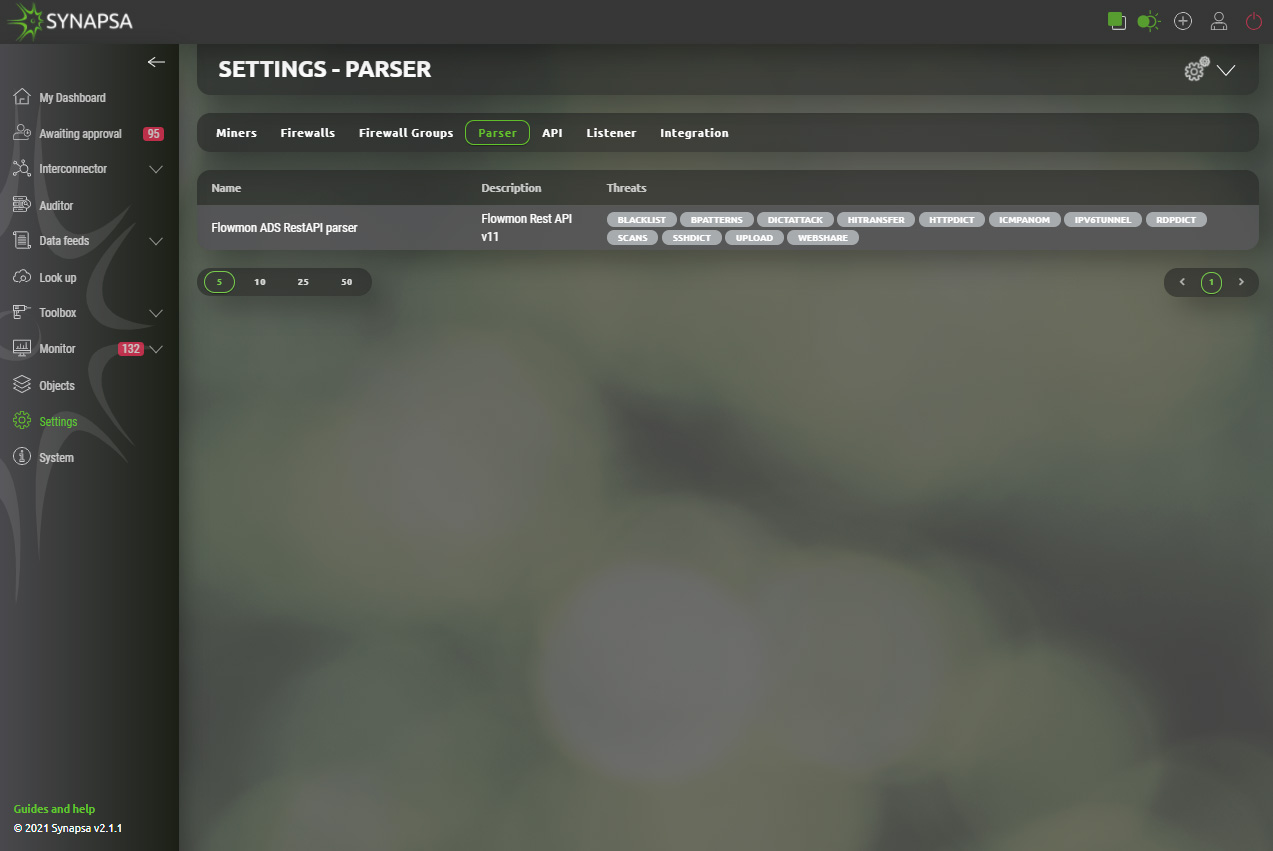
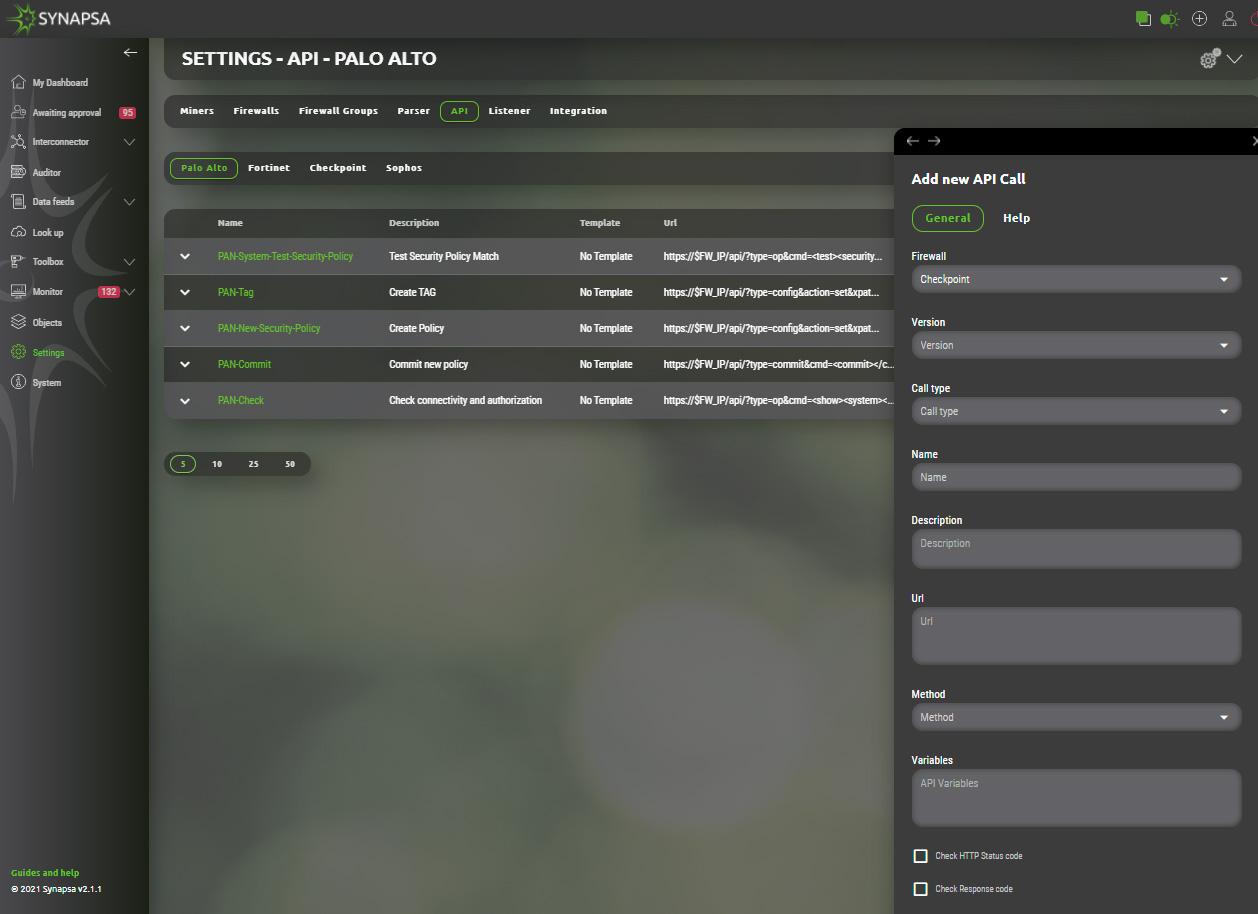
14.5 API
Under the API tab, you can see and modify all the pre-defined ÀPI calls which Synapsa system uses to communicate to devices.
You can also define your own rules with specific parameters and variables. The documentation for API call is included into the Synapsa GUI.
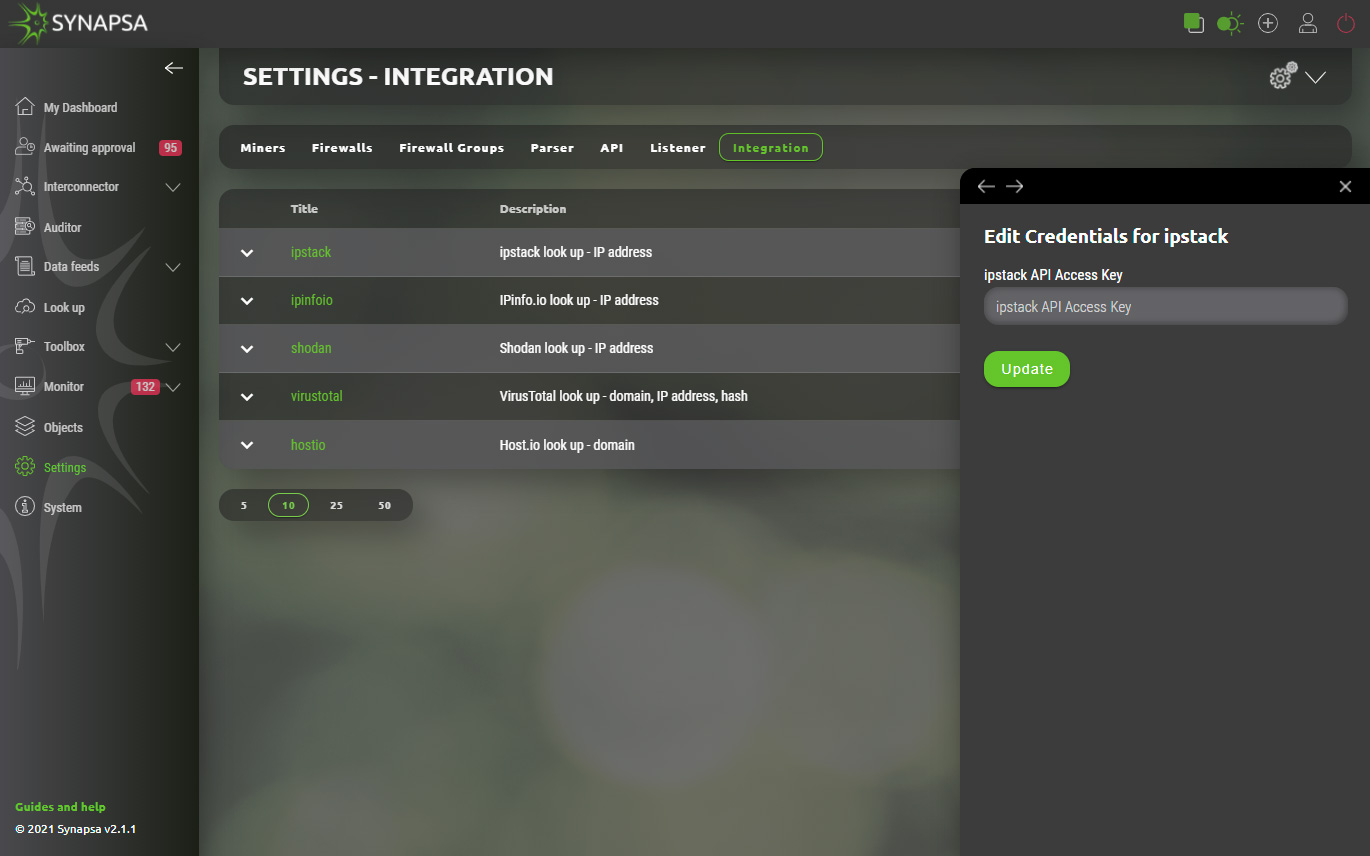
14.6 Integration
Synapsa offers smart integration with various services. List of currently supported services can be found under Synapsa/Settings/Integration section. Activation of any service requires just provision of valid API key/token which administrator needs to acquire from given service provider. Verification state will be displayed next to each service under „Fill“ column.
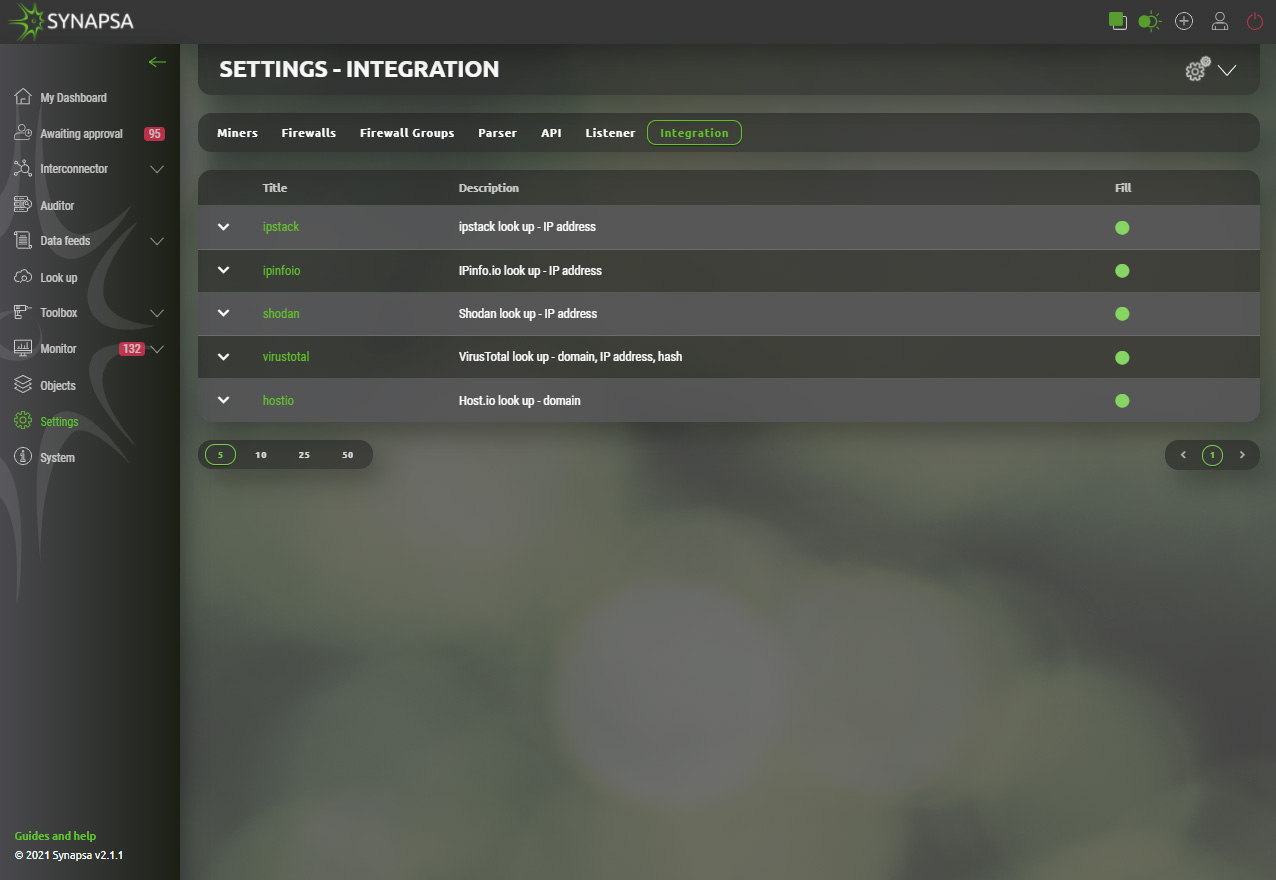
14.6.1 Integration configuration
Configuration process is similar for each service. Upon selection of particular integration Synapsa administrator is asked to provide API key/Token. User is responsible for obtaining and validation of required key from service provider.
Example shows how one of many integrations is configured.
15 System
Centralized configuration of all system parts separated into following subsections.
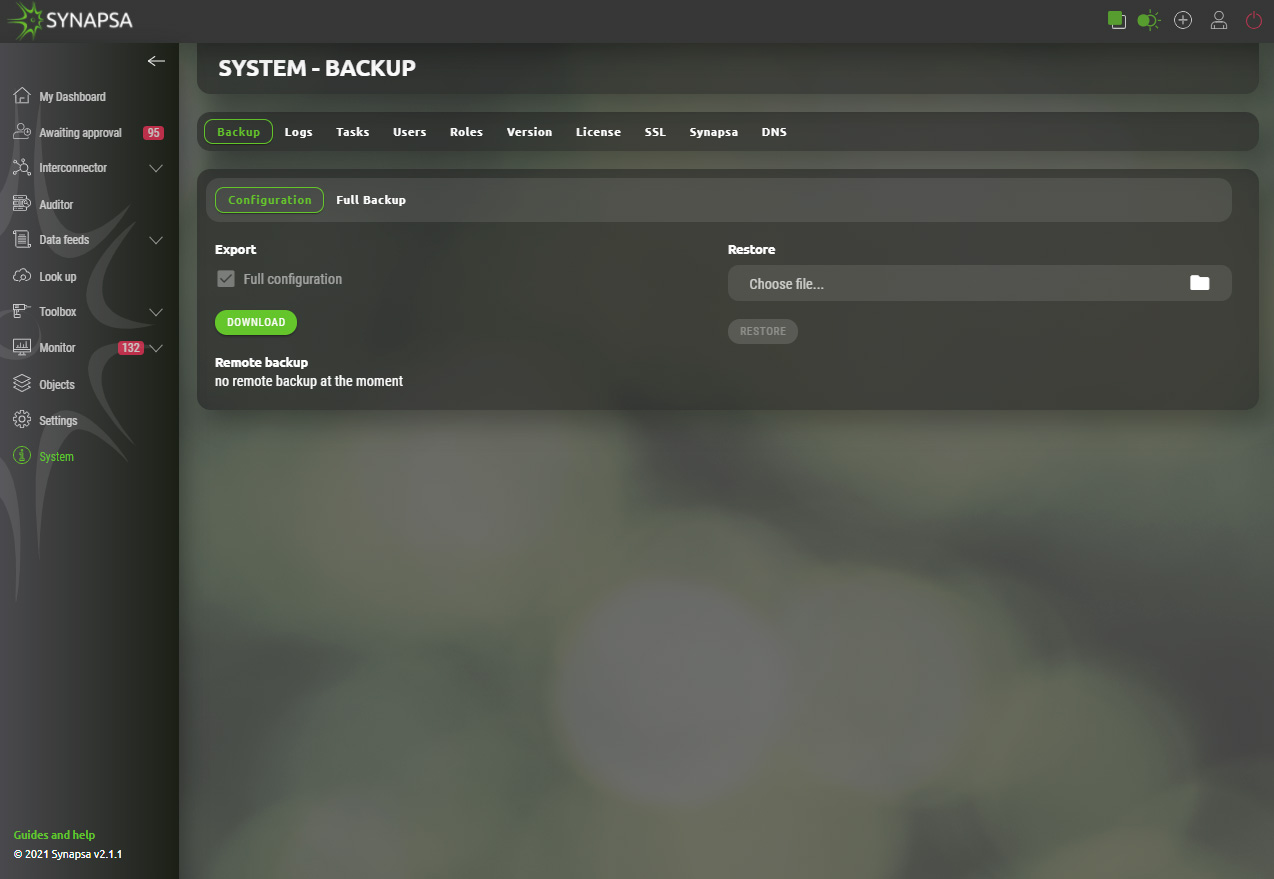
15.1 Backup
Manual export of important system files.
- Configuration – The configuration backup downloads only the xml with the configuration, it also includes users, miners, firewalls and rules. It does not download logs, received and created events.
- Full backup – Downloads the whole DB, in addition to the configuration backup there are also API calls, db logs, etc.
- Restore – Restore previously backed up configuration. The restore will rewrite the currently running configuration. It is important to restore the system to the same version, for example, for a system running version 2.0.0 you have to use version 2.0.0 backup file.
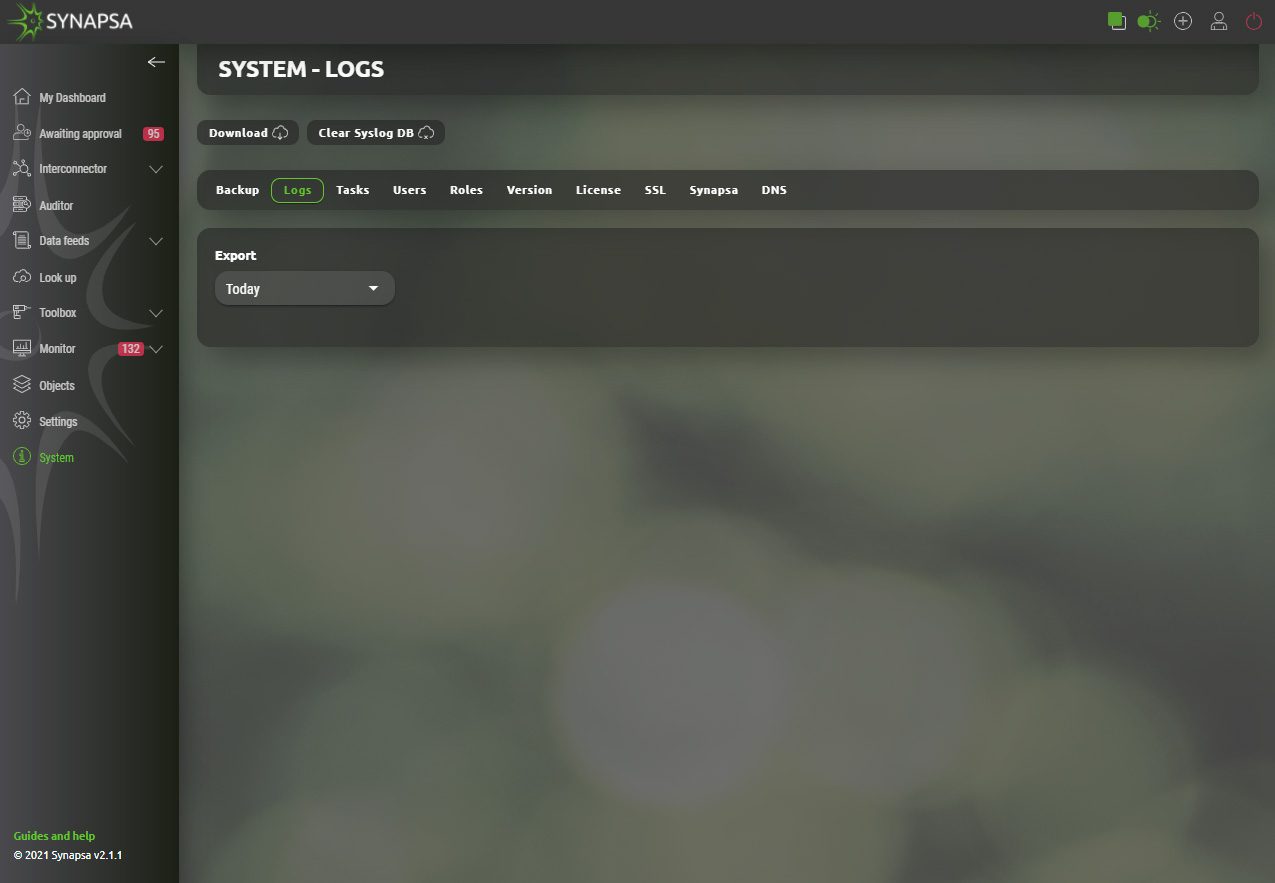
15.2 Logs
Download system logs for Synapsa troubleshooting purposes. The download will not contain any system events or received syslog from the miners.
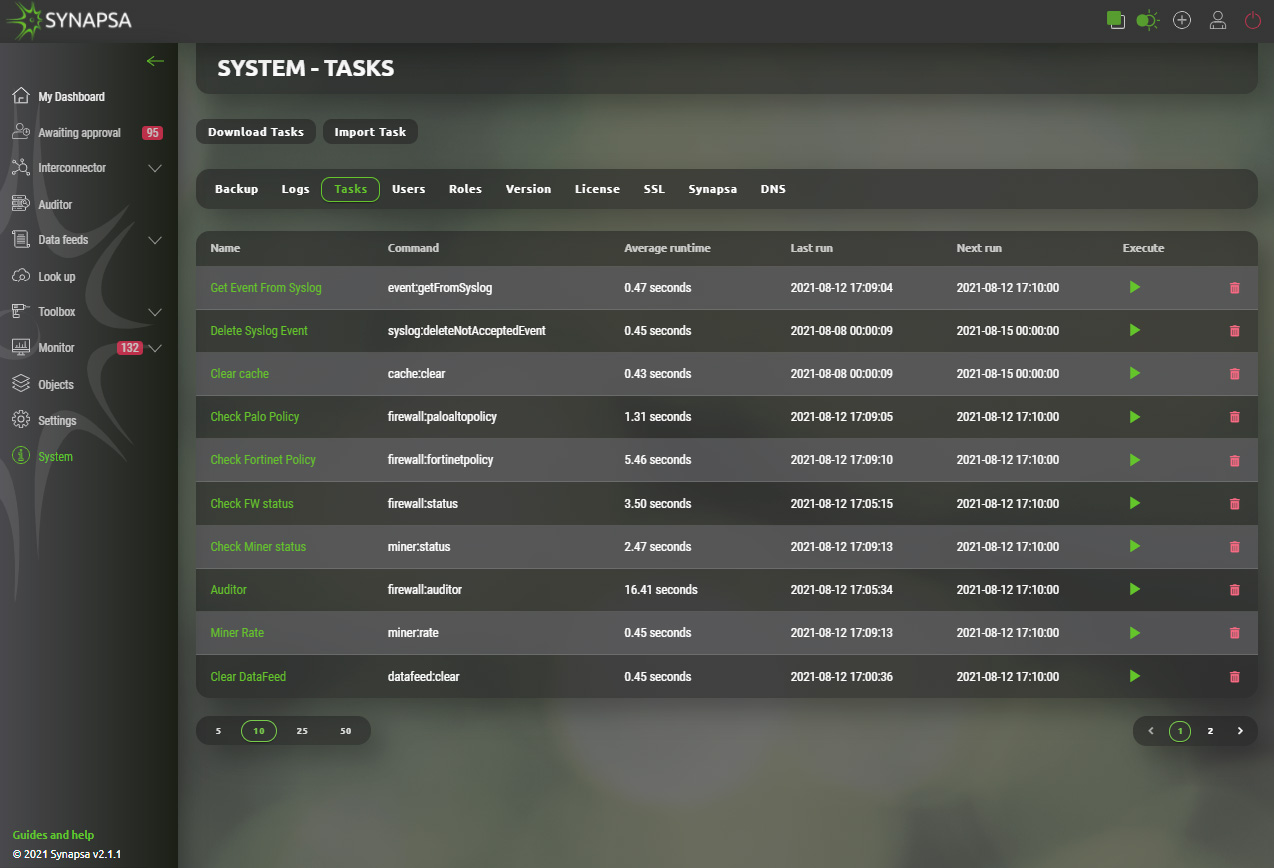
15.3 Tasks
Synapsa does multiple tasks automatically every few minutes, depending on the specific task for its internal purposes. You can manually run a specific task or change the timer to how often the task is executed in the future.
ATTENTION! Do not change any settings unless you fully understand the internal engine!
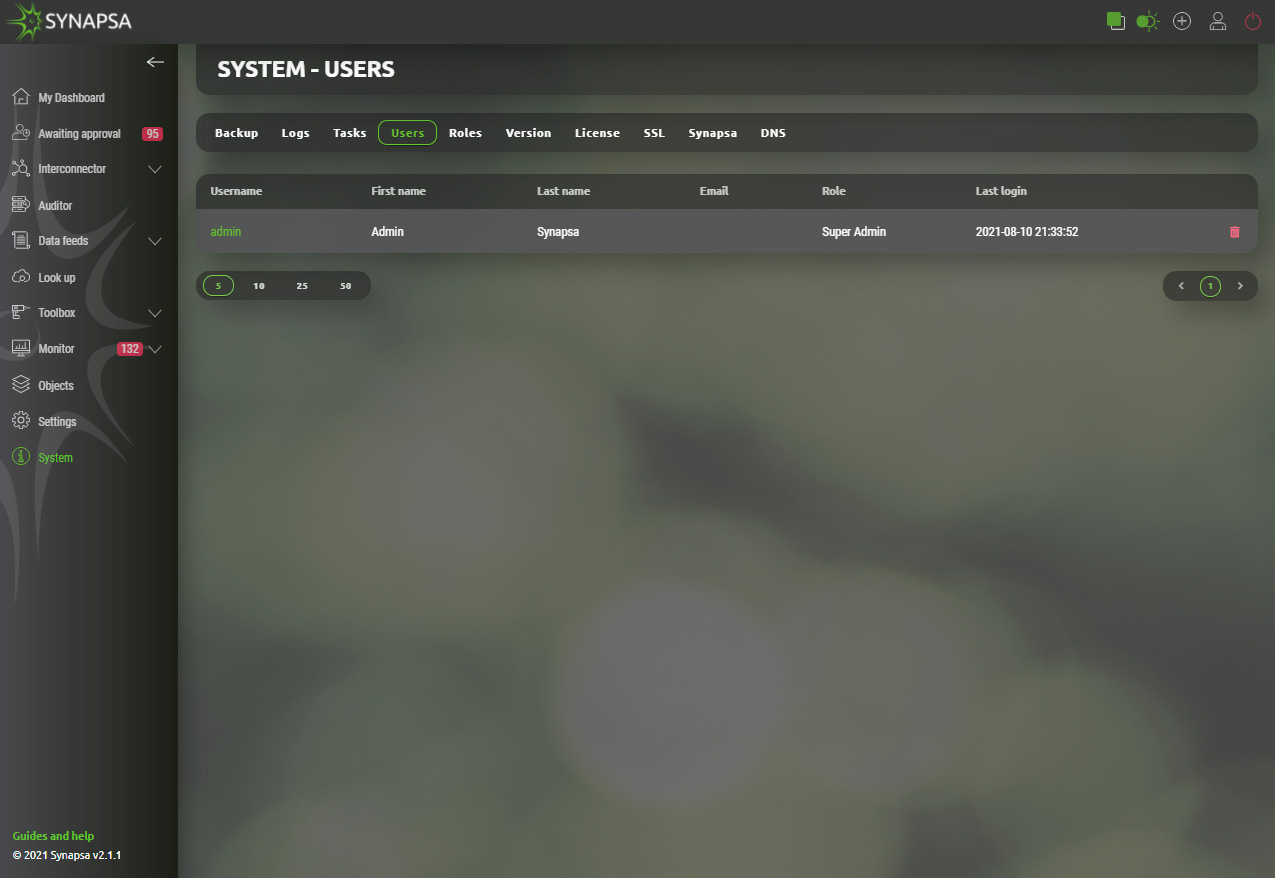
15.4 Users
Local users with their privileges within the Synapsa GUI. You can add new user or change password, role or delete existing users.
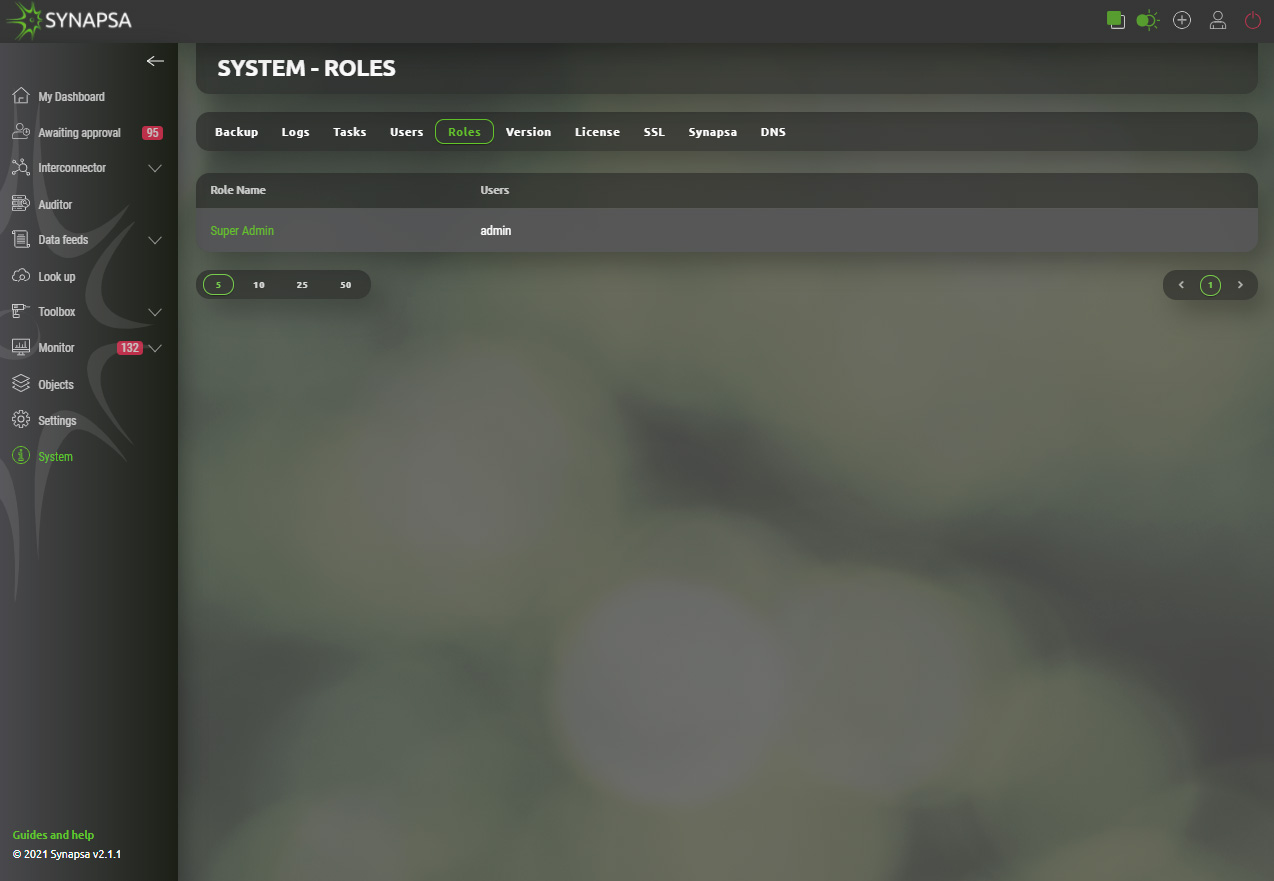
15.5 Roles
Internal user roles settings. Every user has to belong to a user role, giving him permissions. You can either add a new user role or edit pre-configured roles by clicking on its name.
Every menu element in the list has 3 level of permissions to be given to users.
- No permission
- View only
- Full
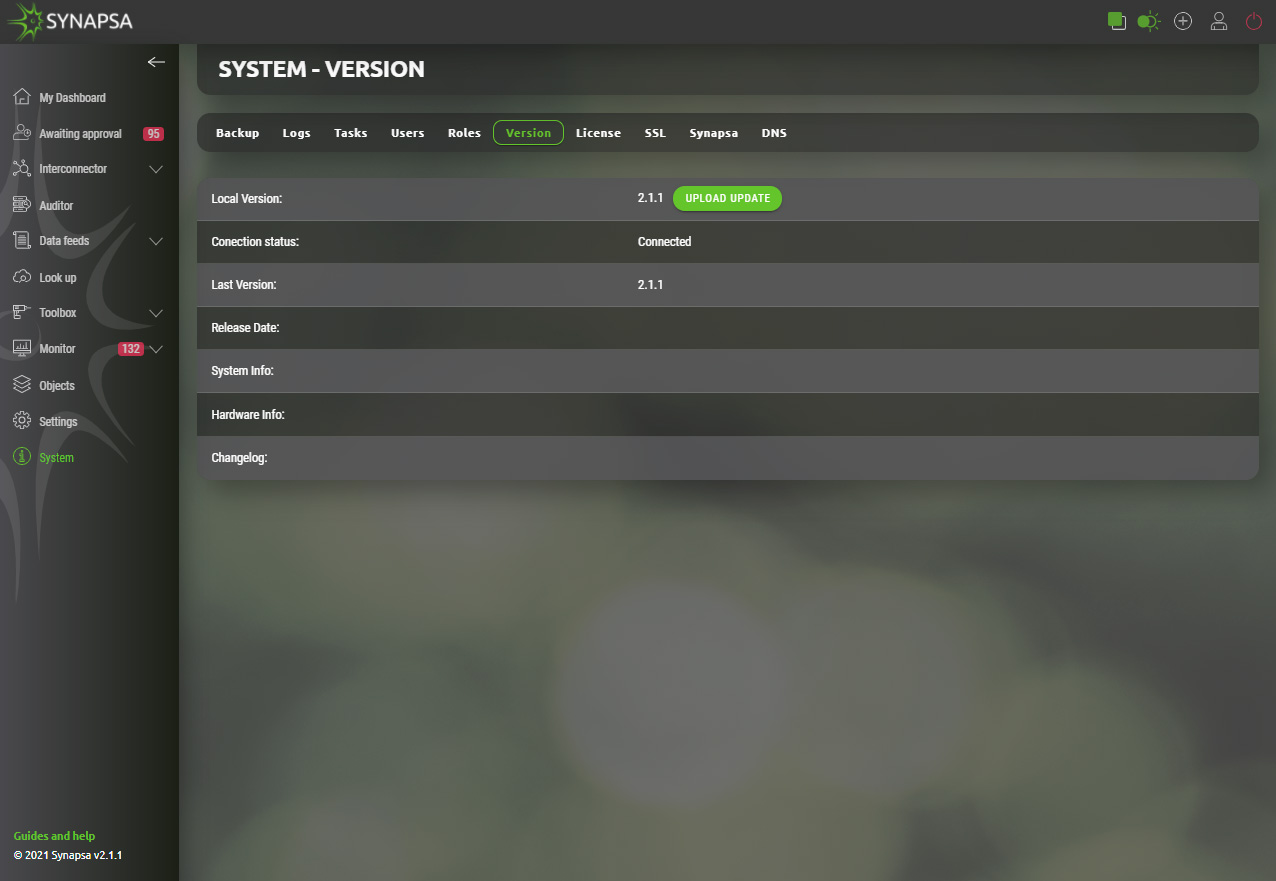
15.6 Version
Displays Synapsa version and check for available updates.
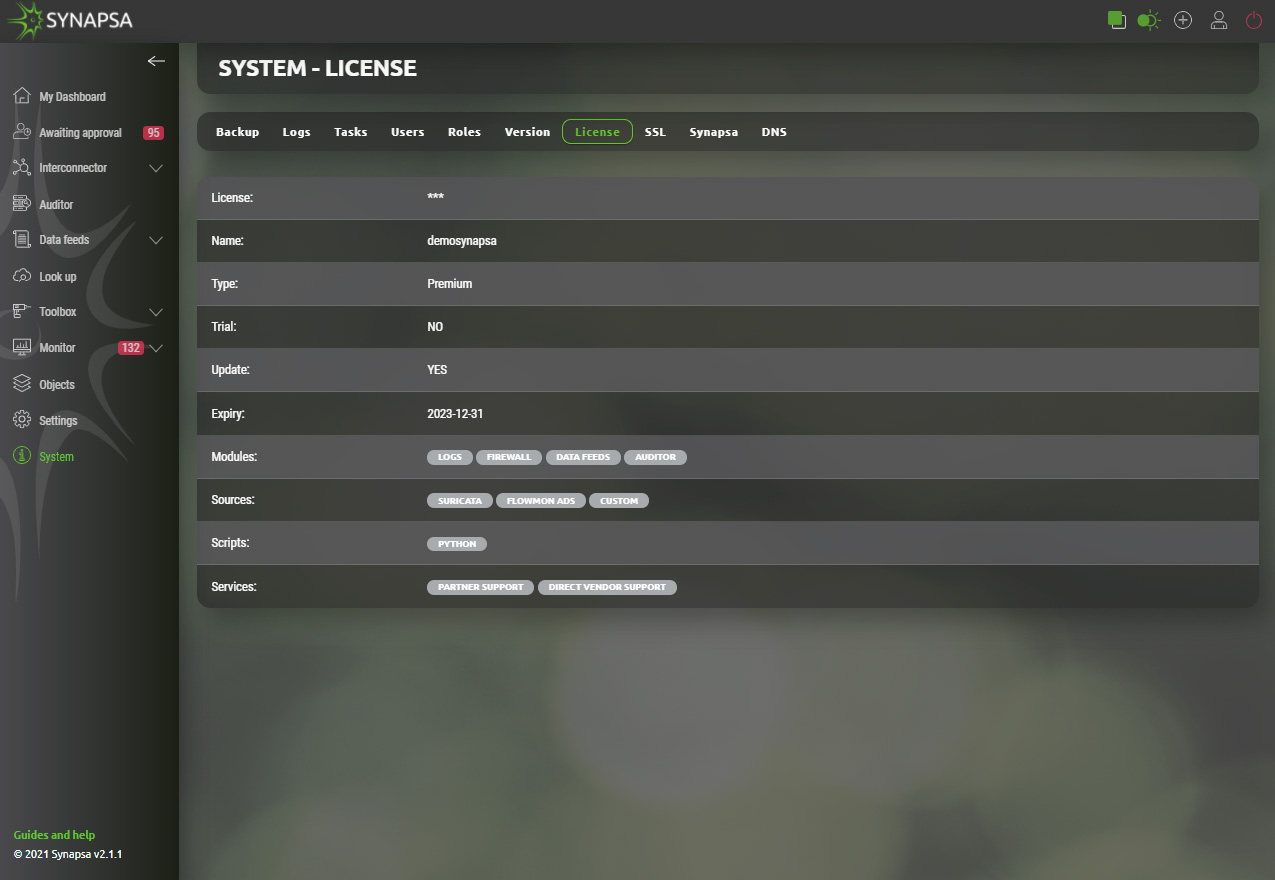
15.7 License
Displays installed Synapsa license and expiration date.
15.8 SSL
SSL settings for Synapsa GUI. You can either generate a new certificate directly from the menu, or import an external certificate.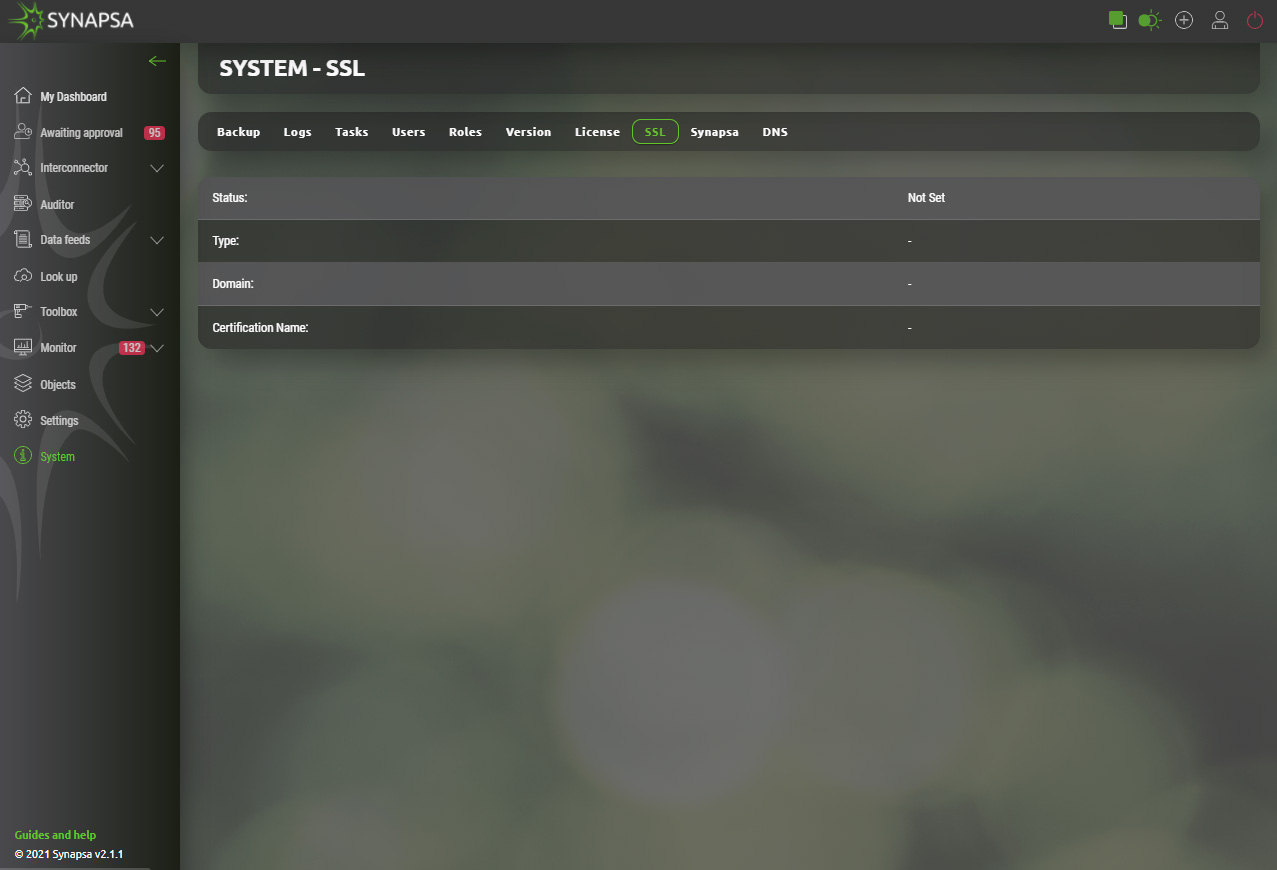
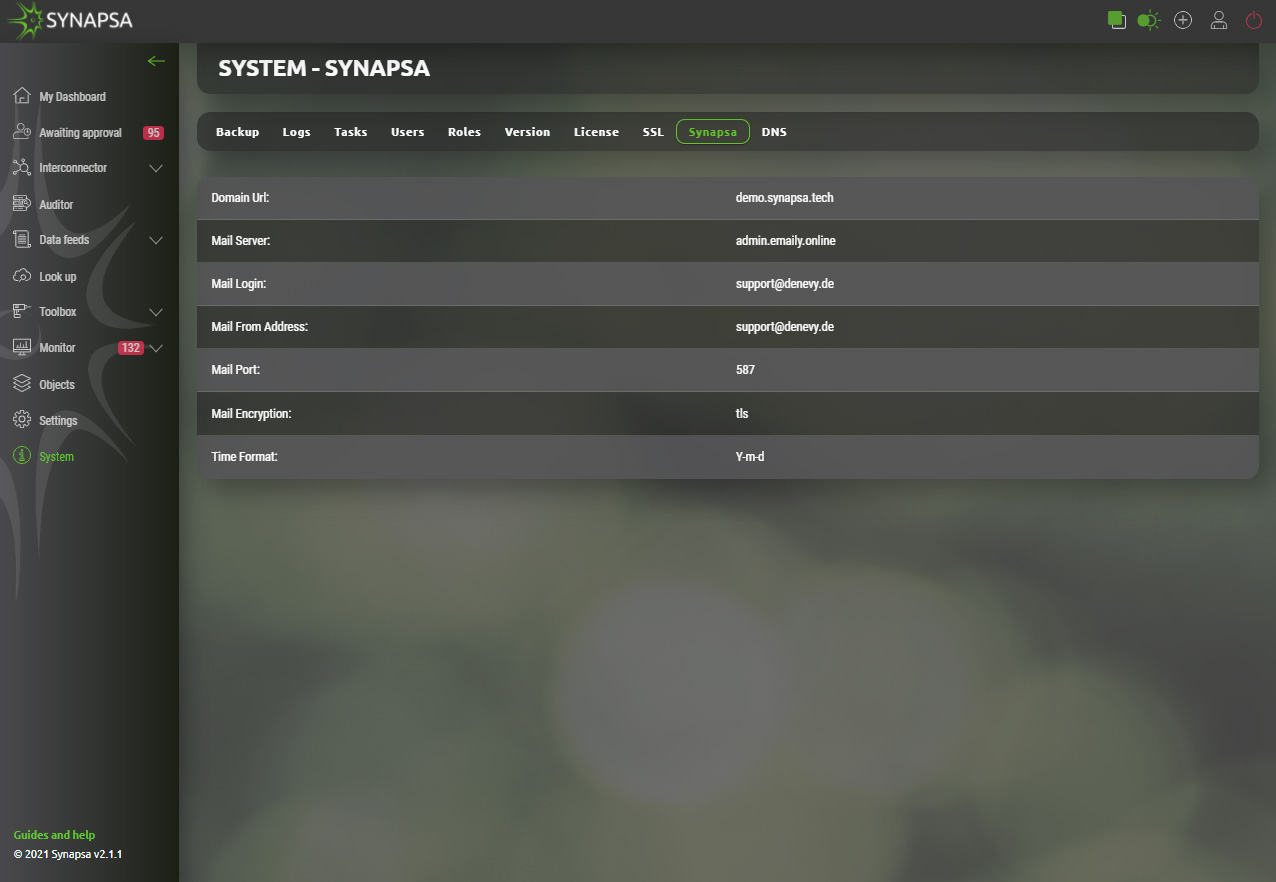
15.9 Synapsa
In this section you can set up the URL address Synapsa is running on and mail server settings, to be used as mail gateway. You can also set up a Date and Time Format to be used in the whole system.
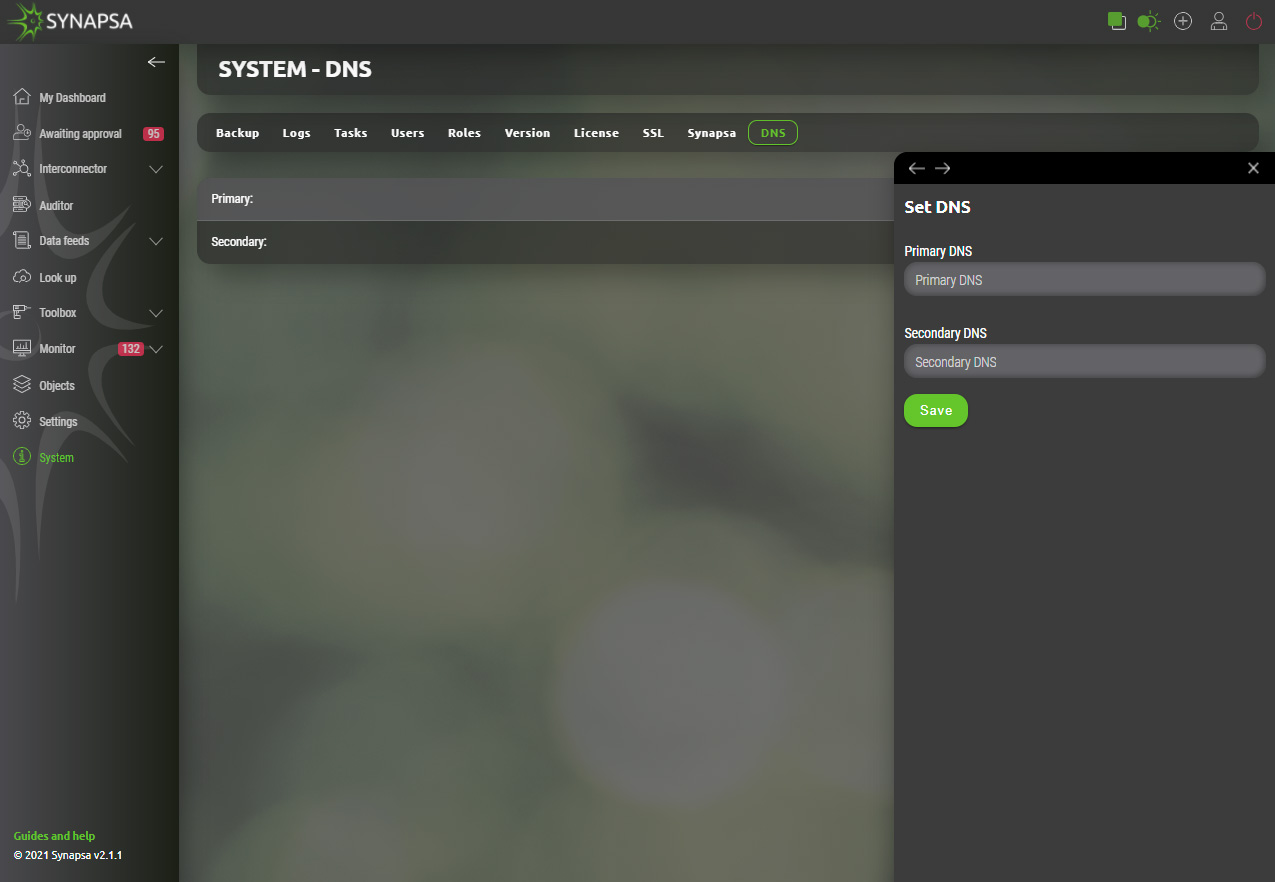
15.10 DNS
Primary and secondary DNS server.
You can find more information about Synapsa on our website www.synapsa.tech, or contact us via email on support@synapsa.tech.